In this article:
Tables provide access to precise numbers and specific information in large, dense data sets. They allow users to scan, compare, and analyze data in multiple directions – in the order of their choice – and take action based on those insights.
In complex apps designed for logistics, project management, sales, customer relations, or human resources, the majority of screens may contain – or simply be – a grid or table.
Our Table stencil offers a completely visual editing experience and lets your team quickly customize single or multiple table cells.
In this article we’ll show you how to add and format tables, and how to customize your columns, rows, cells and text.
Paste data into Moqups
You can paste CSV data directly into an existing table, just as you would with our Chart and Graph stencils.
However, if you don’t have a table already on your page, the Paste in Format feature lets you turn lists and CSV data into instantly populated tables:
- Copy a list or CSV from your desktop
- Use
Ctrl/Cmd+Vto paste that data onto your Moqups page - Click the Table button on the Pick a Format modal
Export or copy data
You can export your table data as a CSV file, or you can copy and paste it.
Export table data as a CSV file
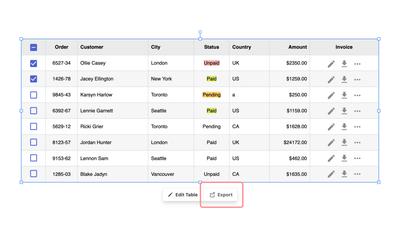
You can export the entire table’s data, or just a selection of cells.
To export your entire table:
- Select the table on your page
- Click the Export button on the blue options bar
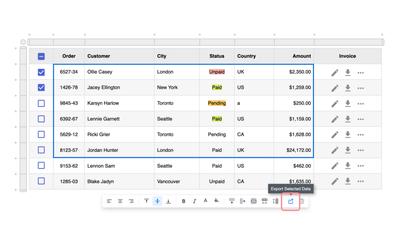
To export a selection of data cells:
- Select the table on your page
- Click the Edit button on the blue options bar
- Hold down the
Shiftkey to select the cells to export - Click the Export button on the formatting toolbar
Copy and paste table data
You can copy data from a table and paste it…
- outside Moqups to a spreadsheet
- within Moqups as text, sticky-notes, flowchart blocks, text, or to another table
To copy data from a table to your clipboard in CSV format:
- Select the table on your page and click Edit Data
- Use
Ctrl/Cmd+Ato select all table cells, or hold downShiftto select a group of cells - Press
Ctrl/Cmd+Cto copy the data - Press
Ctrl/Cmd+Vto paste the data from your clipboard to your destination
Add and resize tables
The Table stencil is found in the Stencils Library and, just like all stencils, can be added to the page, as objects, by single click or drag and drop. When you add a table, the cursor is active in the first cell, so you can start typing right away.
To resize and rescale, drag any of the adjustment handles, and hold down Shift if you want to maintain the tables’ aspect ratio.
- Press
Tabto move to the next cell when you are entering data - Press
Enteron the last cell to create a new row
Stick objects, icons and images to tables
Like our Notes & Annotations and Containers, our Table stencil has sticky capability. Although Tables are not sticky by default, you can quickly turn their stickiness on (and off) in the Format Panel.
Then, you can stick all kinds of other objects – like icons, avatars, or images – to your table, and they’ll stay in place as you move the table.
Format tables
Before diving into your more detailed editing, you can use the dedicated section in the Format Panel to make initial styling decisions about the table as a whole.
Here you can choose to show or hide borders, adjust cell padding, or add zebra stripes to alternate rows or columns.
You can also select the table’s font family and size, set border attributes, or add a drop shadow:
In the text editing section below, we explain how to to use the Quick Format toolbar to further style, color and add links to selected text within the Table
Manage and customize columns, rows, and cells
Click the Edit Data button below the table (or double-click the stencil itself) to enter the table’s Edit Mode.
Once in edit mode, you can:
- Duplicate, insert, move, delete or resize rows and columns
- Merge or split cells
- Change the text color and background of selected cells
Clicking anywhere on the chart will reveal the pop-up toolbar where you can perform these functions.
And, as you’ll see further below, the toolbar will also let you clear, edit, align, style, color, highlight, and apply links to your text.
For all of the following functions, your table must be in edit mode:
Duplicate, insert, or delete rows and columns
To duplicate a row or column – including its existing text – click one of the dots along the horizontal or vertical headers:
To insert an empty row or column, click the Insert Row or Insert Column buttons on the toolbar:
To delete a row or column, make your selection and click the trach button on the toolbar:
Move rows and columns up and down or sideways
To move existing rows or columns within your table, make your selection and then use the Move arrows on the far right of the toolbar.
Resize or distribute rows and columns
To resize rows and columns, use the lines between their headers. If you want to set the rows and columns to equal sizes, just click the Distribute Cell Heights or Distribute Cell Widths buttons.
Merge and split cells
Use the Merge Cells or Split Cells buttons in the pop-up toolbar to perform those actions on selected cells:
Cell background and text color
The toolbar also lets you select the text color and background color for individual cells or selections. Color can help guide the reader’s eye to interesting information, and make it easier for them to navigate your data.
Cell color also comes in handy if you want to create in-table heatmaps – where higher numbers correspond to darker or more saturated cell backgrounds.
Edit table text and content
Click the Edit Data button below the table to enter the table’s Edit Mode.
Once in edit mode, you can select, clear, edit, align, style, color, highlight, and apply links to your text. Clicking anywhere on the table will reveal the table toolbar where you can perform these functions.
And, as we discussed above, the toolbar will also let you insert, move, delete or distribute rows and columns; merge or split cells; change the text color and background of selected cells.
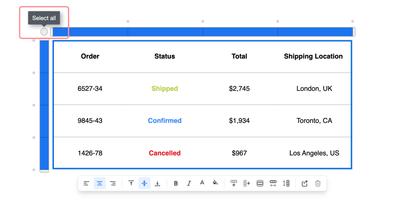
Select, color, or clear table stencil content
Click the Edit Data button (or double-click on the table) to reveal the table headers and toolbar. The round button in the top-left corner will Select all of the table’s cells; you can also use Cmd + A.
Now you can use the toolbar to change the font color and background color throughout the entire table.
Once the entire table has been selected, you can also use your keyboard’s Delete key to clear all existing data and return to a blank table.
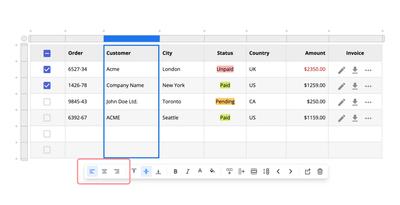
Text alignment in tables
Select a row or a column’s header, or choose a single cell or selection of cells. Then, use the toolbar to adjust the text’s horizontal and vertical alignment:
Rich-text editing to style, color and add links
With a cell selected, press Enter/Return or double-click to edit the text. If you simply want to replace the text, then just start typing!
While you’re in edit mode, you can use either the cell-editor or the table toolbar to format, style, color and highlight selected text, or to add links.
While in edit mode:
- Hit the
Tabkey to quickly navigate between table cells. - Press
Shift+Tabto go back to the previous cell.