

Find the right chart and graph for your data

Bar Chart
Create a bar graph to track changes over time, identify
best-to-worst performers, or rank values from largest to
smallest.

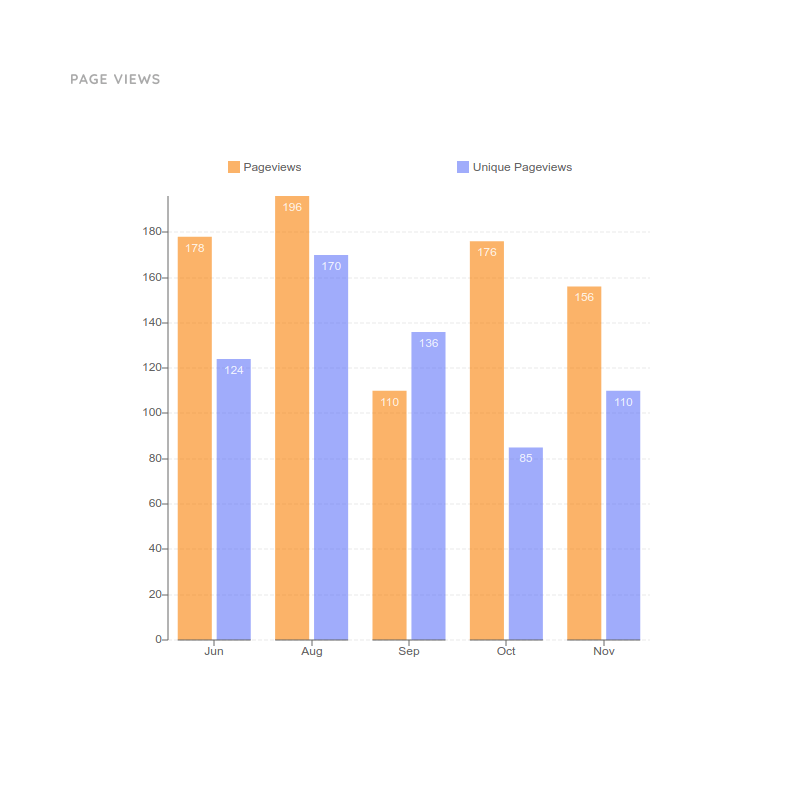
Column Chart
Make a column graph to display all kinds of business,
financial, and logistical data, and represent negative
values more effectively.

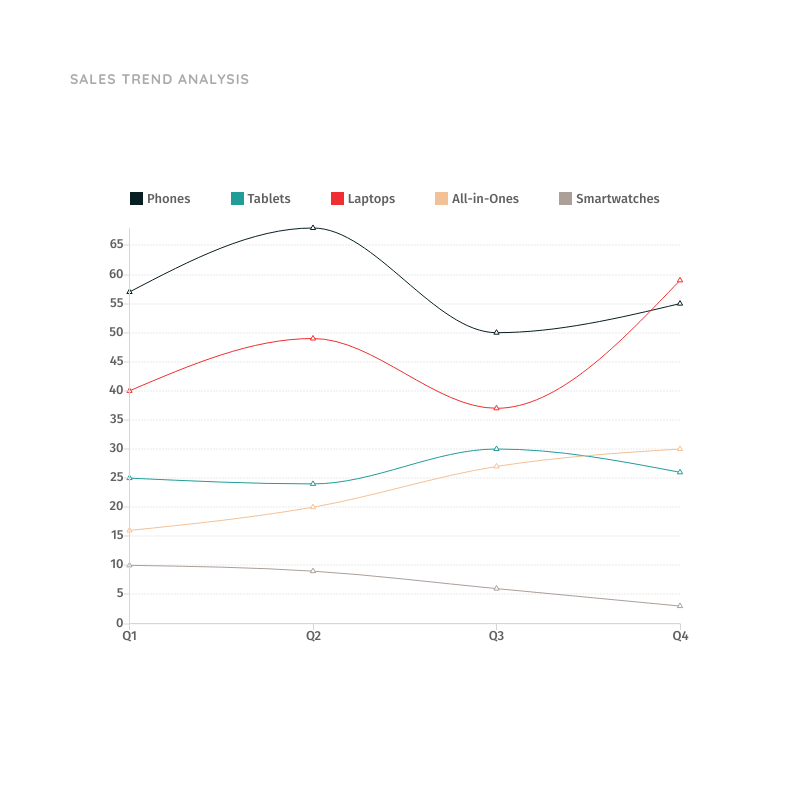
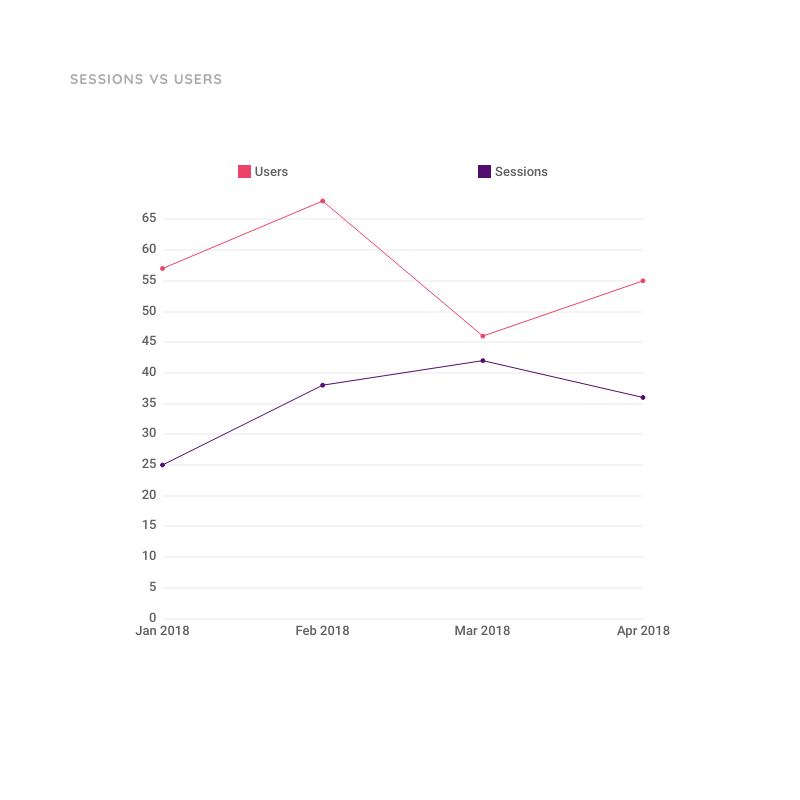
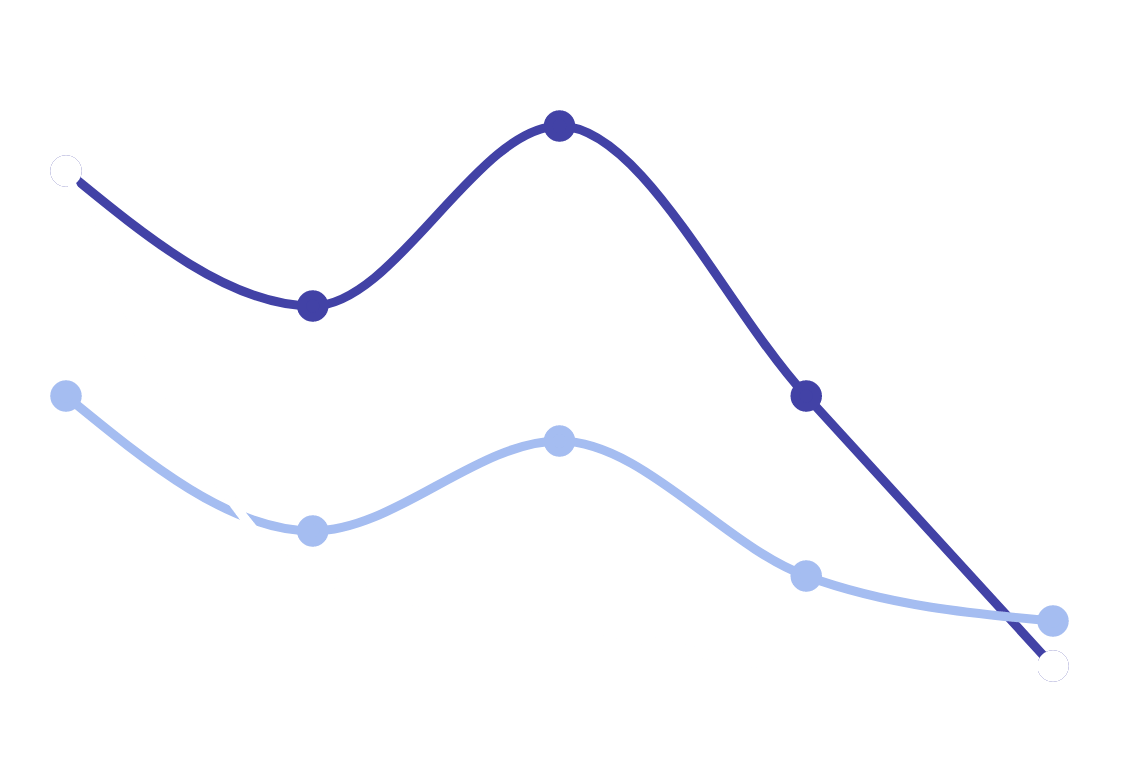
Line Chart
Use a line graph to visualize progress over time or distance
by connecting continuous data points with line segments.

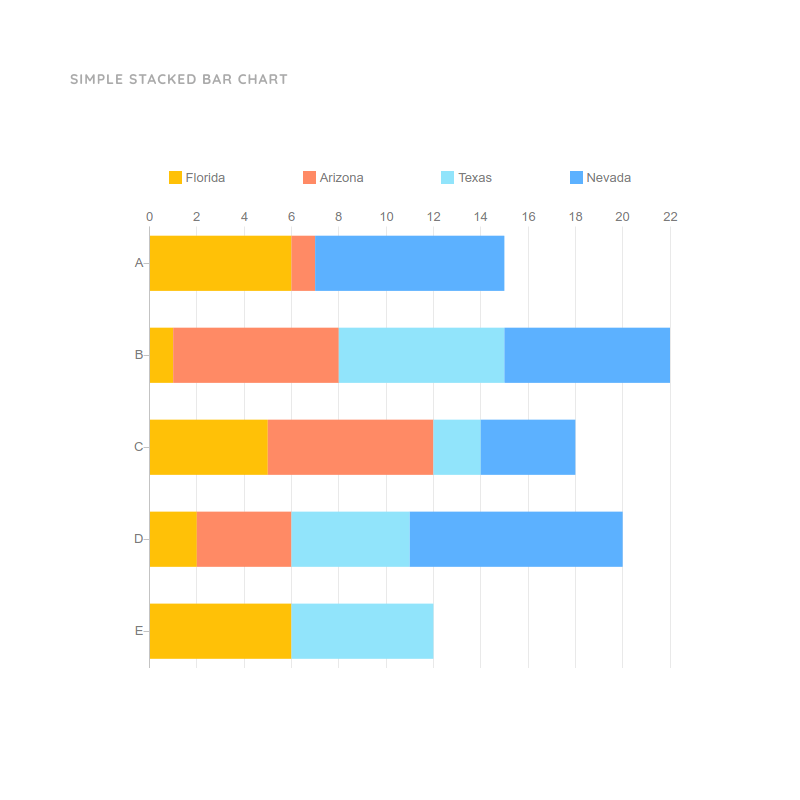
Stacked Bar Chart
Build a stacked bar graph to create layers within your bars,
and show how sub-groups contribute to each category's
total.

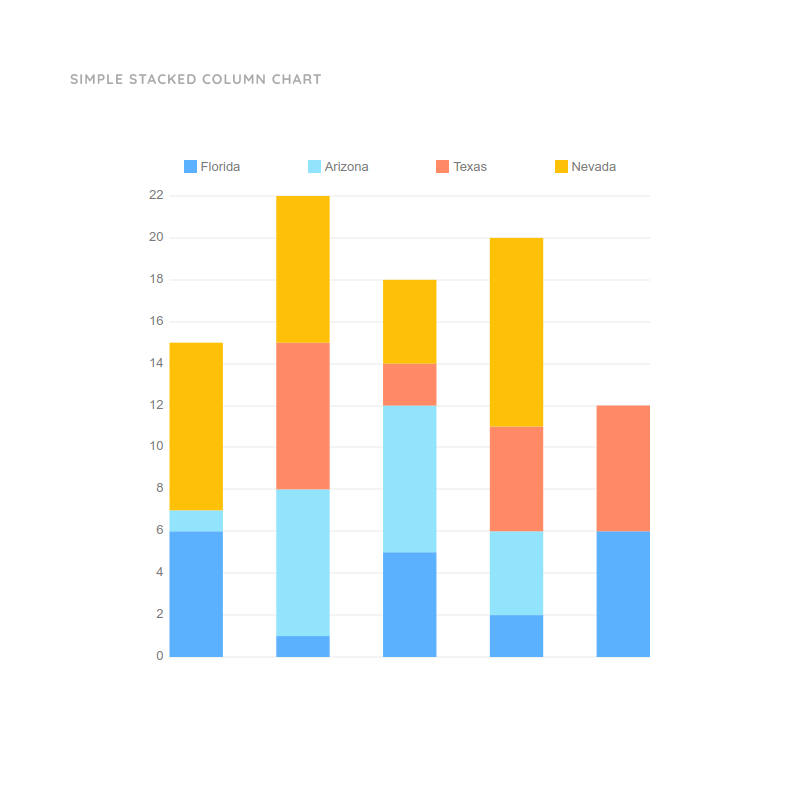
Stacked Column Chart
Use a stacked column graph to depict increasing values –
like dates or income groups – while also including subgroups
within your columns.

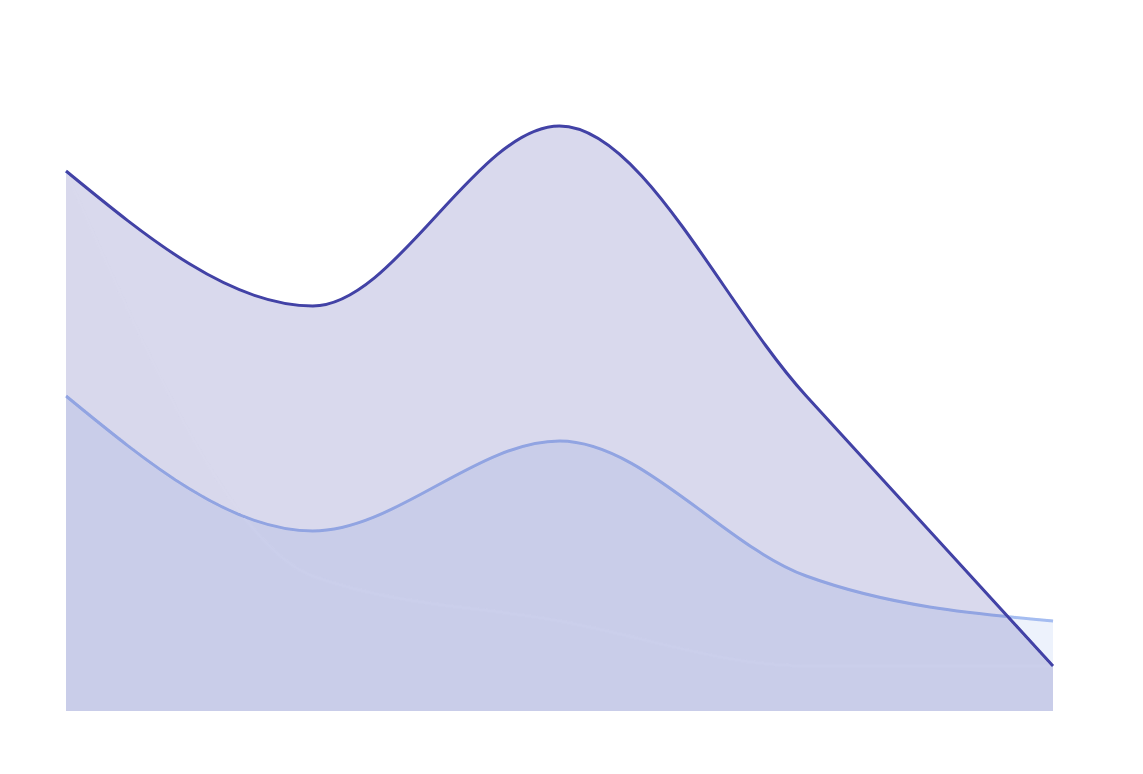
Area Chart
Create an area graph to compare related groups within a
category, and present part-to-whole relationships as they
change over time.

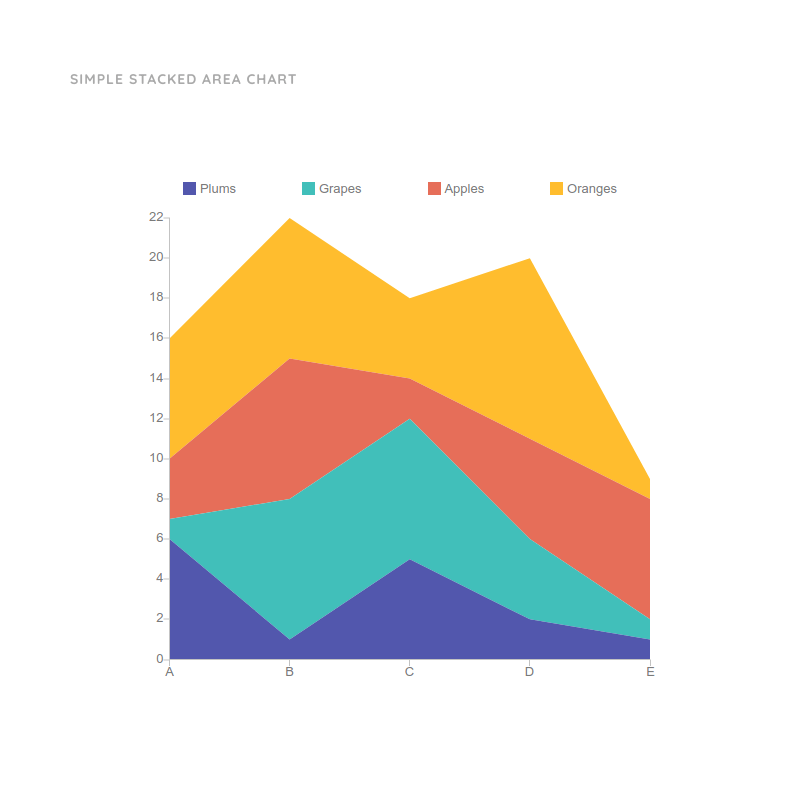
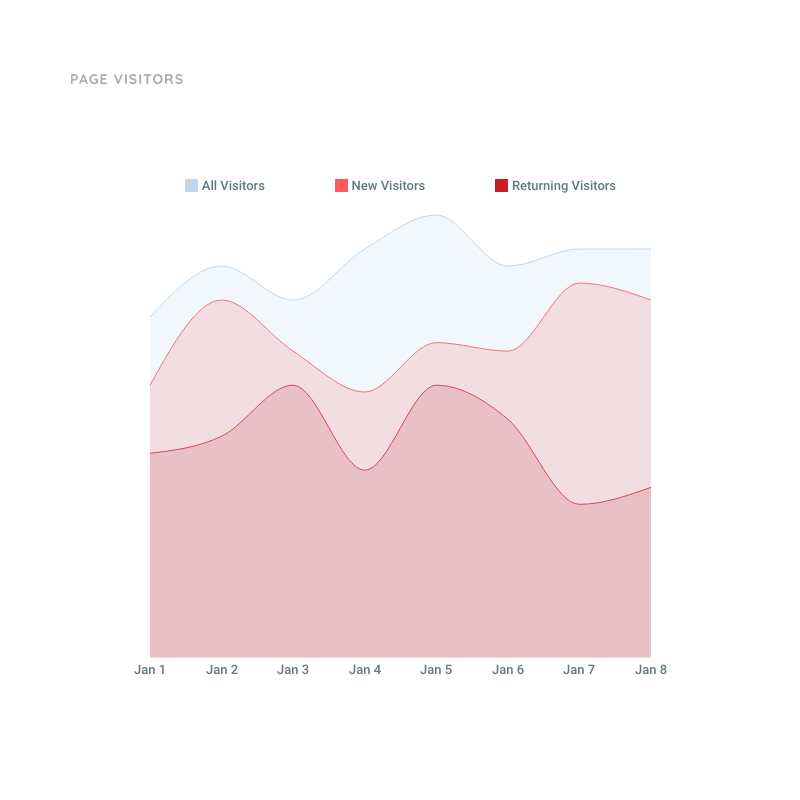
Stacked Area Chart
Create a stacked area graph to track parts of a whole over
time, and to analyze trends like page visits by source, or
revenue vs expenses.

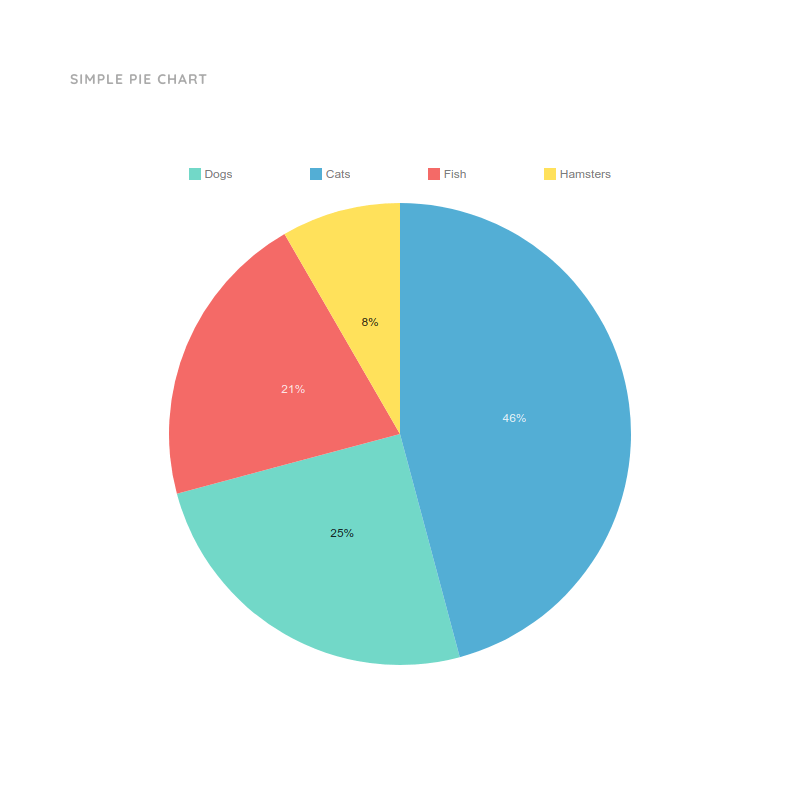
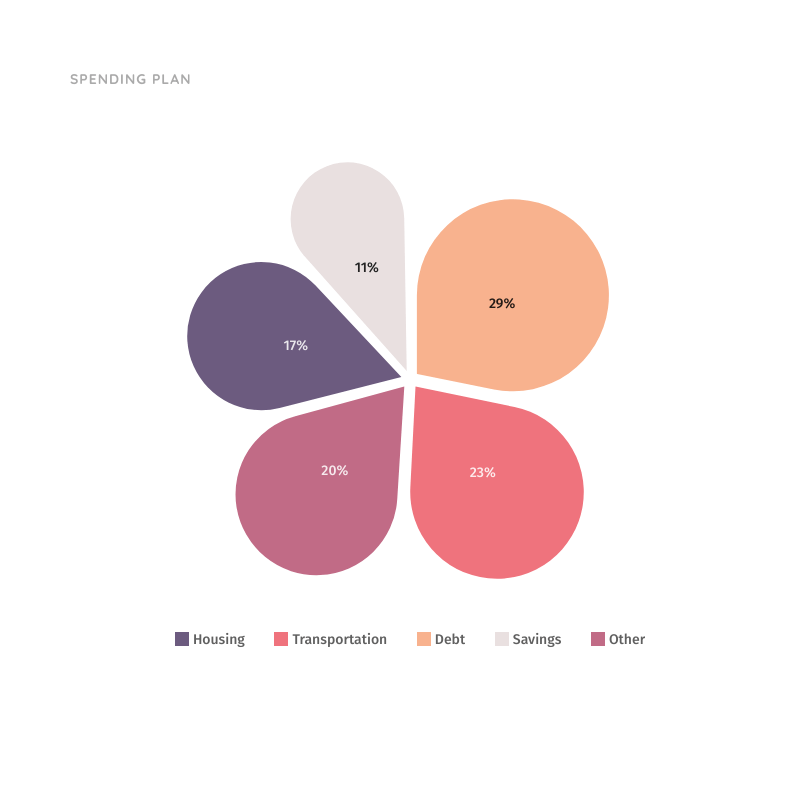
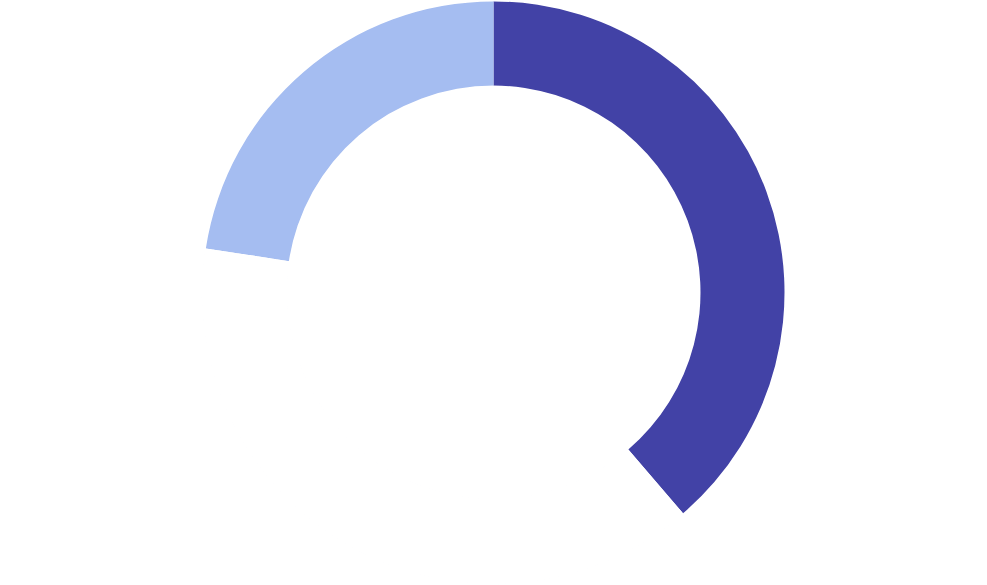
Pie Chart & Donut Chart
Use a pie or donut graph to show categories as slices and
percentages – and make part-to-whole relationships easy to
grasp.

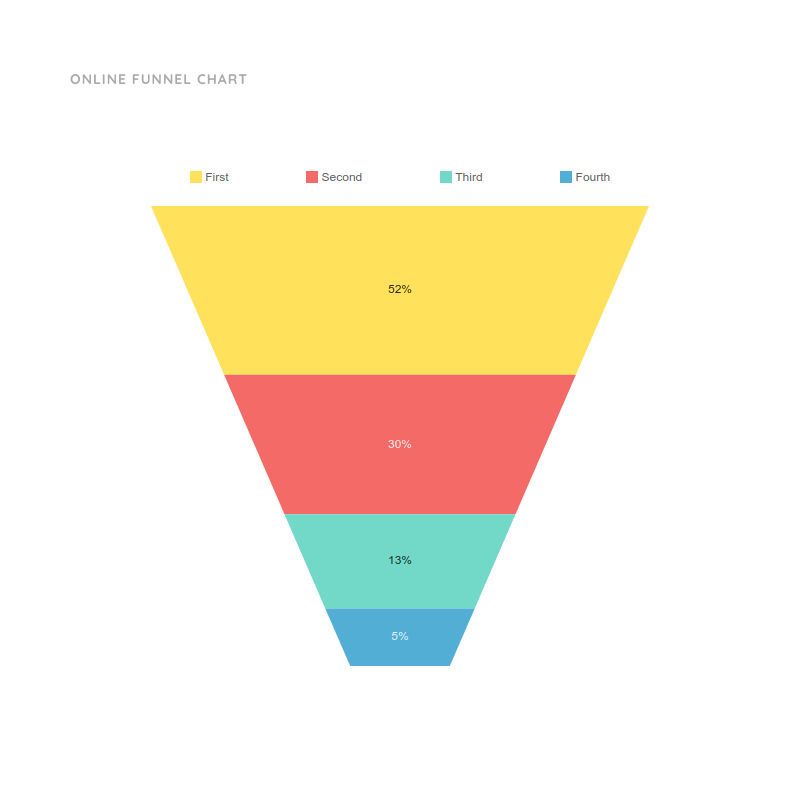
Funnel Chart
Make a funnel chart to analyze the progressive stages of a
process or procedure to identify problems and remove
bottlenecks.
And experiment freely
With a click, you can explore a variety of beautiful data visualizations
to find just the right one for your audience and information!


As both a product owner and a CEO with 75 employees, I use Moqups primarily for product design. But we’ve also used it for everything from org charts to laying out our office space. It’s incredibly intuitive, fast, and accessible everywhere. It’s literally my favorite tool.