In this article:
Diagrams are powerful tools that can help teams map out complex systems, illustrate complicated hierarchies, organize ideas, structure websites, plan implementations, and design user flows.
They’re essential to any project’s success – and a key part of a project’s rhythm and flow at every stage of development and implementation. And, as projects evolve, teams need up-to-date diagrams and flowcharts immediately at hand – for reference, guidance and documentation.
In the Stencils Library, you’ll find a wide range of Flowchart, UML, Use Case, and ERD Model diagram stencils, all designed to attach quickly to our smart Connectors.
In this article, we’ll explain each of our Diagram stencil categories. We’ll also show you how to add diagram stencils to the page, and how to attach, format and label their Connectors.
Finally, you’ll learn some tips and tricks, like how to swap out one diagram stencil for another, or expand flows with just a quick click of the Extender arrows.
Diagram stencil categories
In the Stencils Library, you’ll find four categories of diagram stencils. With them, your team can create and improvise any kind of diagram:
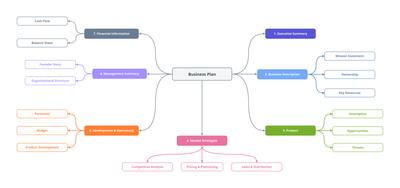
Flowchart Diagrams
Flowcharts are the most flexible and adaptable diagram stencils. They are typically used for brainstorming and ideation, information architecture, data management, business process modelling, structural analysis, process engineering, and more.
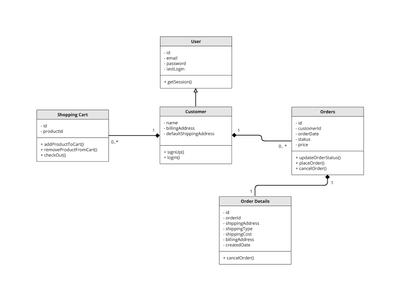
UML
UML diagrams utilize Unified Modeling Language to help teams understand the structure and behavior of software solutions. They visualize a system’s components and interactions by documenting its objects, actors, attributes, operations, and relationships.
For more info about the 14 different types of UML diagrams – and pre-made templates for each kind – check out our UML diagram creator page.
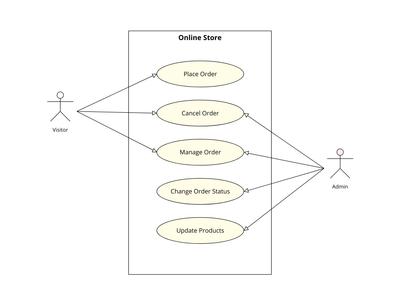
Use Case
Use case diagrams model the set of actions, services, and functions that a system needs to perform. By illustrating a scenario’s specific use cases, actors, and goals, these behavioral diagrams help teams understand a system’s functional requirements and scope.
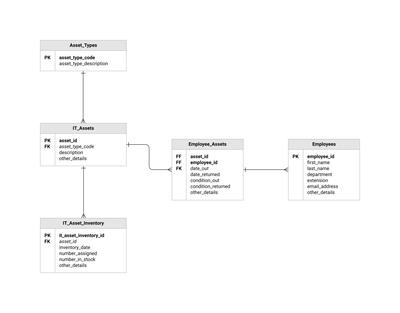
ERD Model
An Entity Relationship Diagram represents the structure of a database by showing how entities within it – people, roles, objects, products or concepts – relate to one another. The diagram depicts the entities, attributes, and interconnected relationships within that system’s scope.
To see examples of all these kinds of diagrams, check out our collection of free, curated Diagrams & Flowchart Templates. Use these examples to jump-start your project, understand best-practices, or just to experiment.
Add, style, and name diagram stencils
Just like all Moqups stencils, you can add diagram stencils to the page, as objects, by single click or drag and drop. And, as with other kinds of objects, you can style them by using the Format Panel.
When you type text into any diagram stencil those stencils automatically adopt the text as their name. This makes it easy to identify specific diagram elements in the Outline Panel, especially in complex flow and process diagrams.
Attach connectors in diagram mode
Our smart Connectors can be used to connect any Moqups object, stencil or image – not just our dedicated diagram stencils!
To connect any two objects on the page:
- Enter Diagram Mode by clicking the Diagram button in the top-toolbar or press
D. - You’ll immediately see groups of pale blue dots (connecting points) appear around the edges of the objects on the page.
- Click on one of these dots, and drag the cursor towards the second object.
- As the connector approaches the second object, it will snap and “stick” – showing that it’s attached. You can connect to one of the connecting points, or to anywhere else on the object’s edge. The connectors remain attached, even as you move, resize or rotate objects.
- To exit Diagramming mode, just click anywhere on an empty surface on the page, or hit
DorEsc.
The Diagram Button dropdown reveals the Quick Draw toolkit for fast mockups and annotations. These tools – including a new Pencil – come with speedy keyboard shortcuts and a dedicated styling section in the Format Panel.
Format connectors
Connectors can be used to connect any Moqups object, but they are designed to work – and be styled – in combination with our diagram stencils. New connectors inherit the style of the last connector used on that page.
You can format connectors in Edit Mode, either individually, or as a selection. Clicking on any connector will open the Connector Style section of the Format Panel.
When you select a single connector, that connector’s name is displayed at the top of the panel. This makes it easy to locate and identify that connector in the Outline Panel.
When you select multiple connectors, the panel displays the number of connectors in that group, in order to help you confirm your selection before applying any style changes or transformations.
You can set your connector’s color, width, stroke-style, and pick from a range of line-styles (orthogonal, orthogonal rounded, curved or straight). You can also choose from a range of start-and-end markers, adjust the connector’s opacity, and add both Drop Shadow and Blur.
Unless you make a change, all the connectors you draw, going forward, will adopt these style settings.
Swap Start & End Markers: Hold down Shift + X to reverse the start and end markers of any connector; this is the same keystroke that reverses the Fill and Stroke style when an object is selected.
Label connectors
An essential component for diagramming is the ability to add labels directly to connector lines. This is especially important for workflow diagrams, where you may need to indicate Yes or No decisions. Labels are also useful for delineating connector lines in complex diagrams, making it easier to identify them – and to navigate.
To add one or more labels to any connector, simply double-click on the connector line. And, once you add a connector label, it will automatically remain attached to that line – and adjust intelligently as you modify and update your diagram.
And you can quickly reuse your labels by cloning them. Copy-and-paste, or just drag a label while holding down the Alt/Option key – just as you would do with any other Moqups objects.
We’ve also designed a terrific feature to speed your workflow: The ability to detach and reconnect labels. Just click and pull any label away from a line; the label will automatically detach and, as you drag it towards a different line, it will seamlessly and intelligently snap into place.
Diagram extenders
Diagram Extenders make expanding your flows as simple as a keystroke, and they work on all diagram stencils.
Selecting any diagram stencil on the page will reveal arrows on all four sides of those objects. Clicking on any arrow will duplicate that object, automatically connect them, and then open the new object’s text-edit mode for quick renaming.
When there is an unlocked diagram stencil immediately adjacent from the one you are ‘extending’, clicking the extenders will automatically connect those two objects. Otherwise, the extender will create a new diagramming object.
For lighting-fast, omnidirectional work, Shift + Alt/Option + Arrow keys also adds and connects objects.
Sticky containers
Within the Flowchart Diagrams category, the Container stencil is used to create both process and swimlane diagrams, and to group objects in network diagrams.
Because of its specific use cases, the container has some unique formatting features: stickiness and orientation.
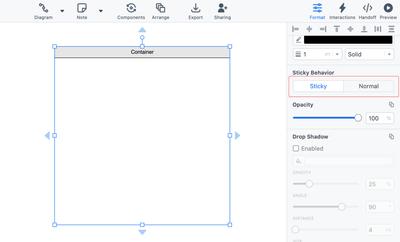
Container Stickiness
The container stencil is sticky by default – in three different ways! You can…
- Use the container to capture objects already on the page
- Add objects to the container from the stencil library or page
- Use the magnet effect to connect multiple containers together
Once objects are captured or added to a container, they move with that container. This makes it easy to group and organize the content of your diagram.
You can toggle a container’s stickiness on and off in the Sticky Behavior section of the Format Panel.
Our Notes & Annotations stencils also have a sticky behavior that lets you attach them to any object on the page.
Container Orientation
When you add a container to the page, you can choose its orientation – vertical or horizontal – in the Container Orientation section of the Format Panel.
You can use containers to group and organize any kind of object, and for any reason – in fact, we encourage you to improvise – but there are three primary use cases that are worth noting here:
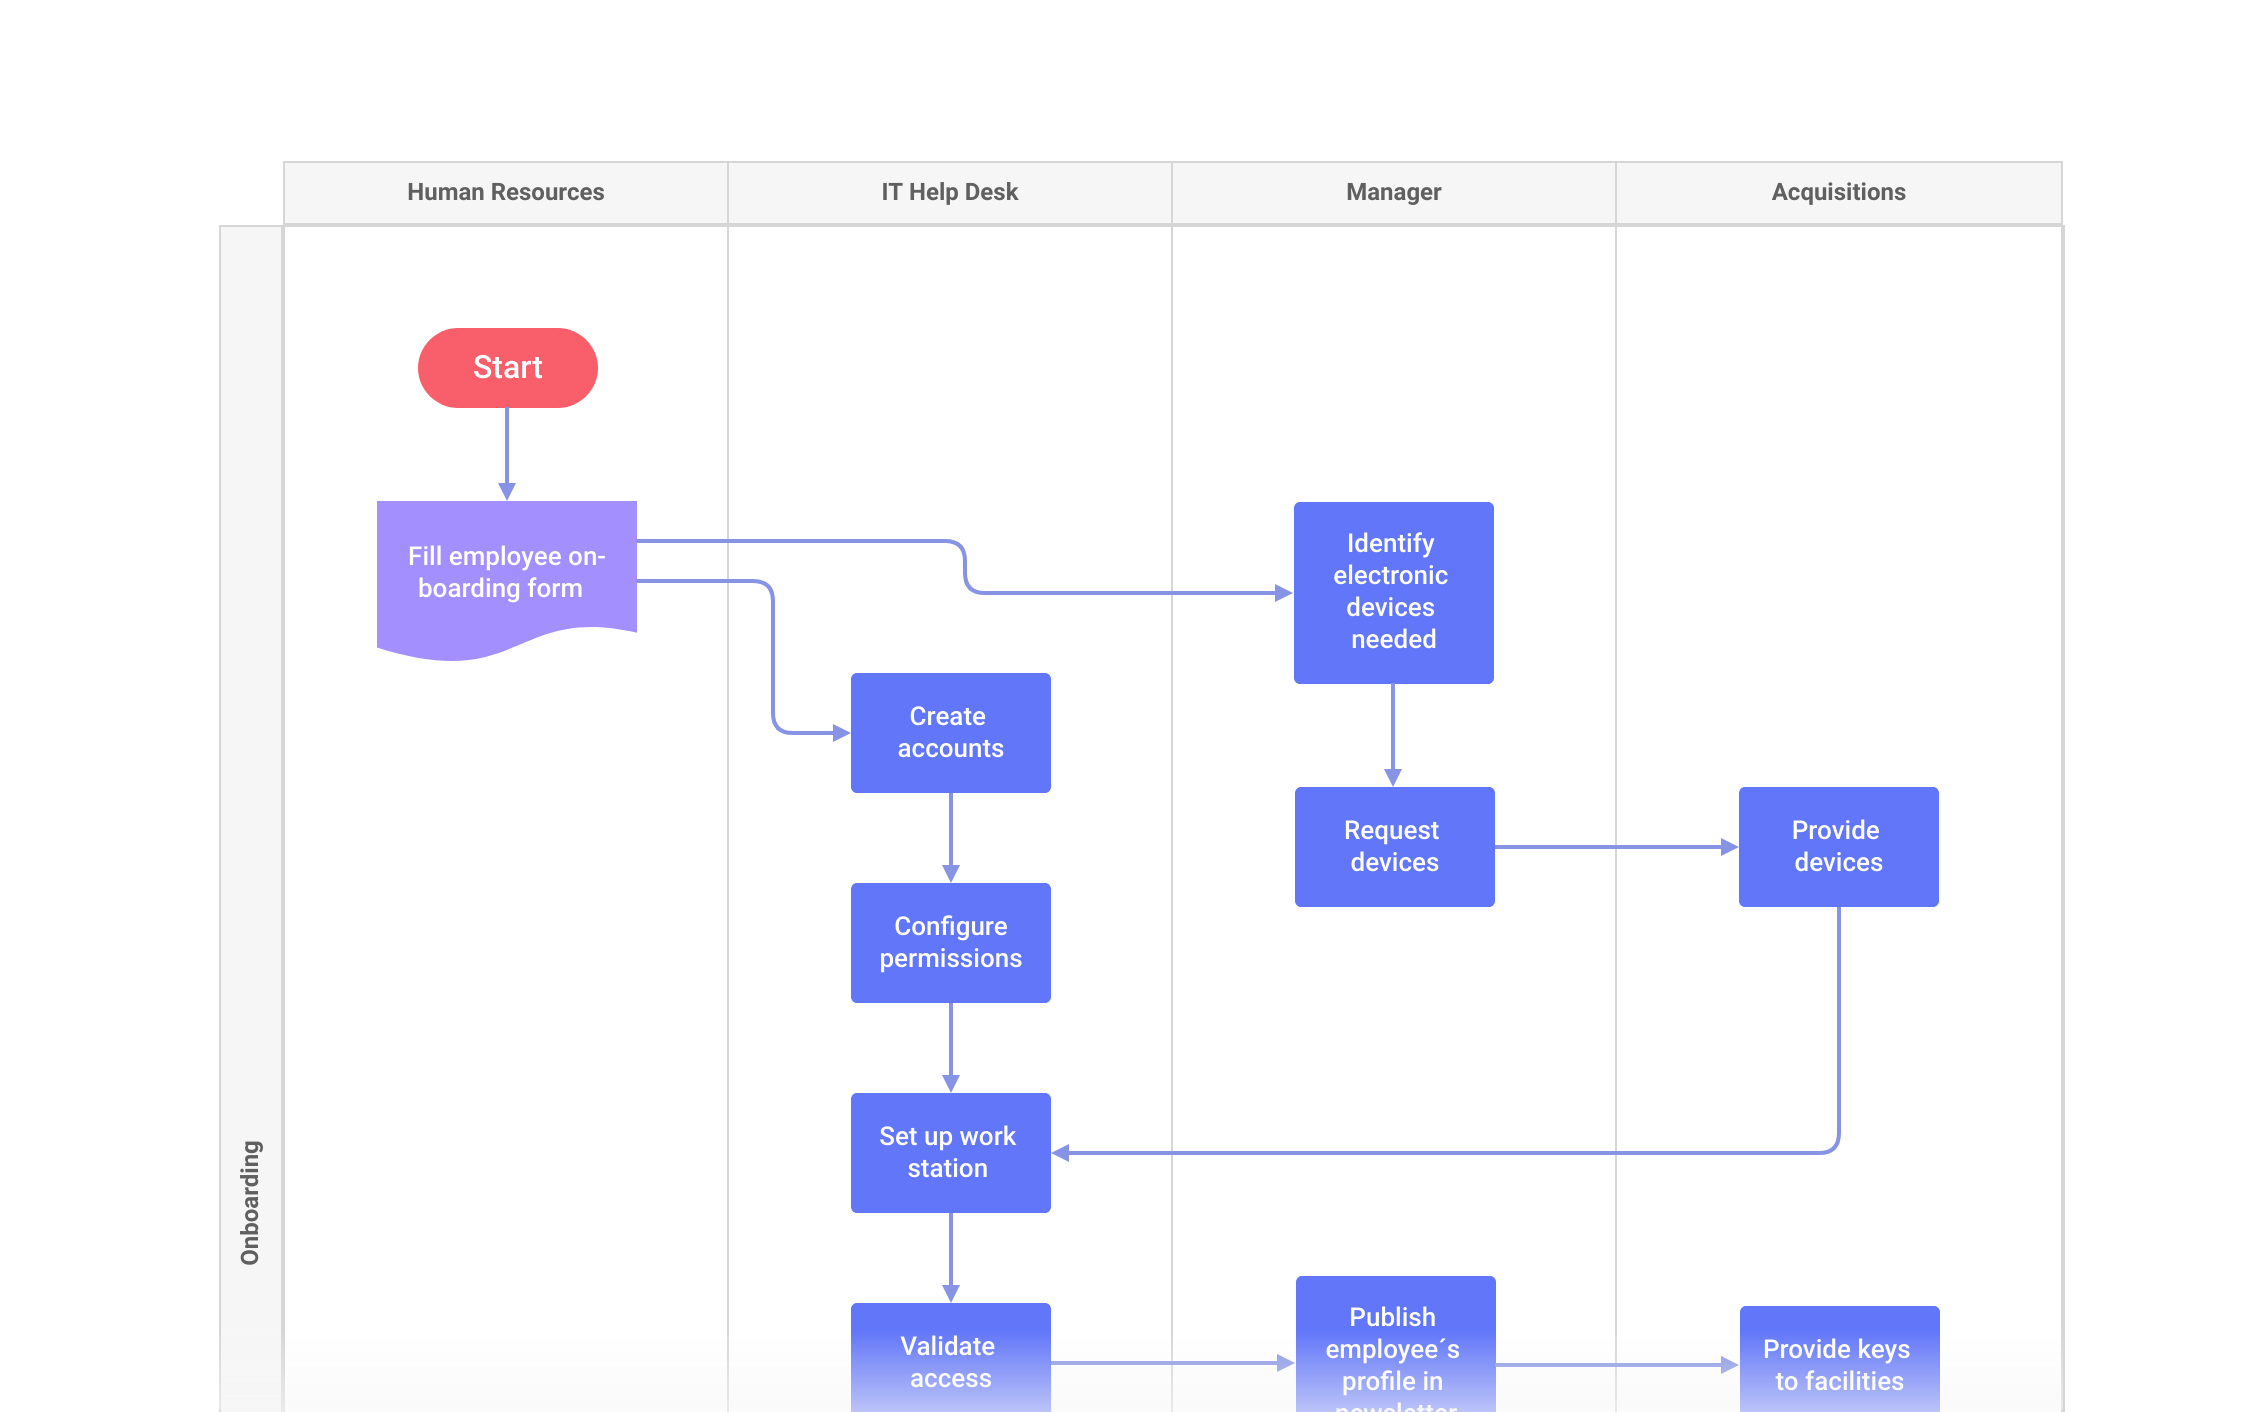
Process Diagrams
Use containers to create swimlanes and pools for all kinds of process diagrams – delineating areas of responsibility and clarifying who does what.
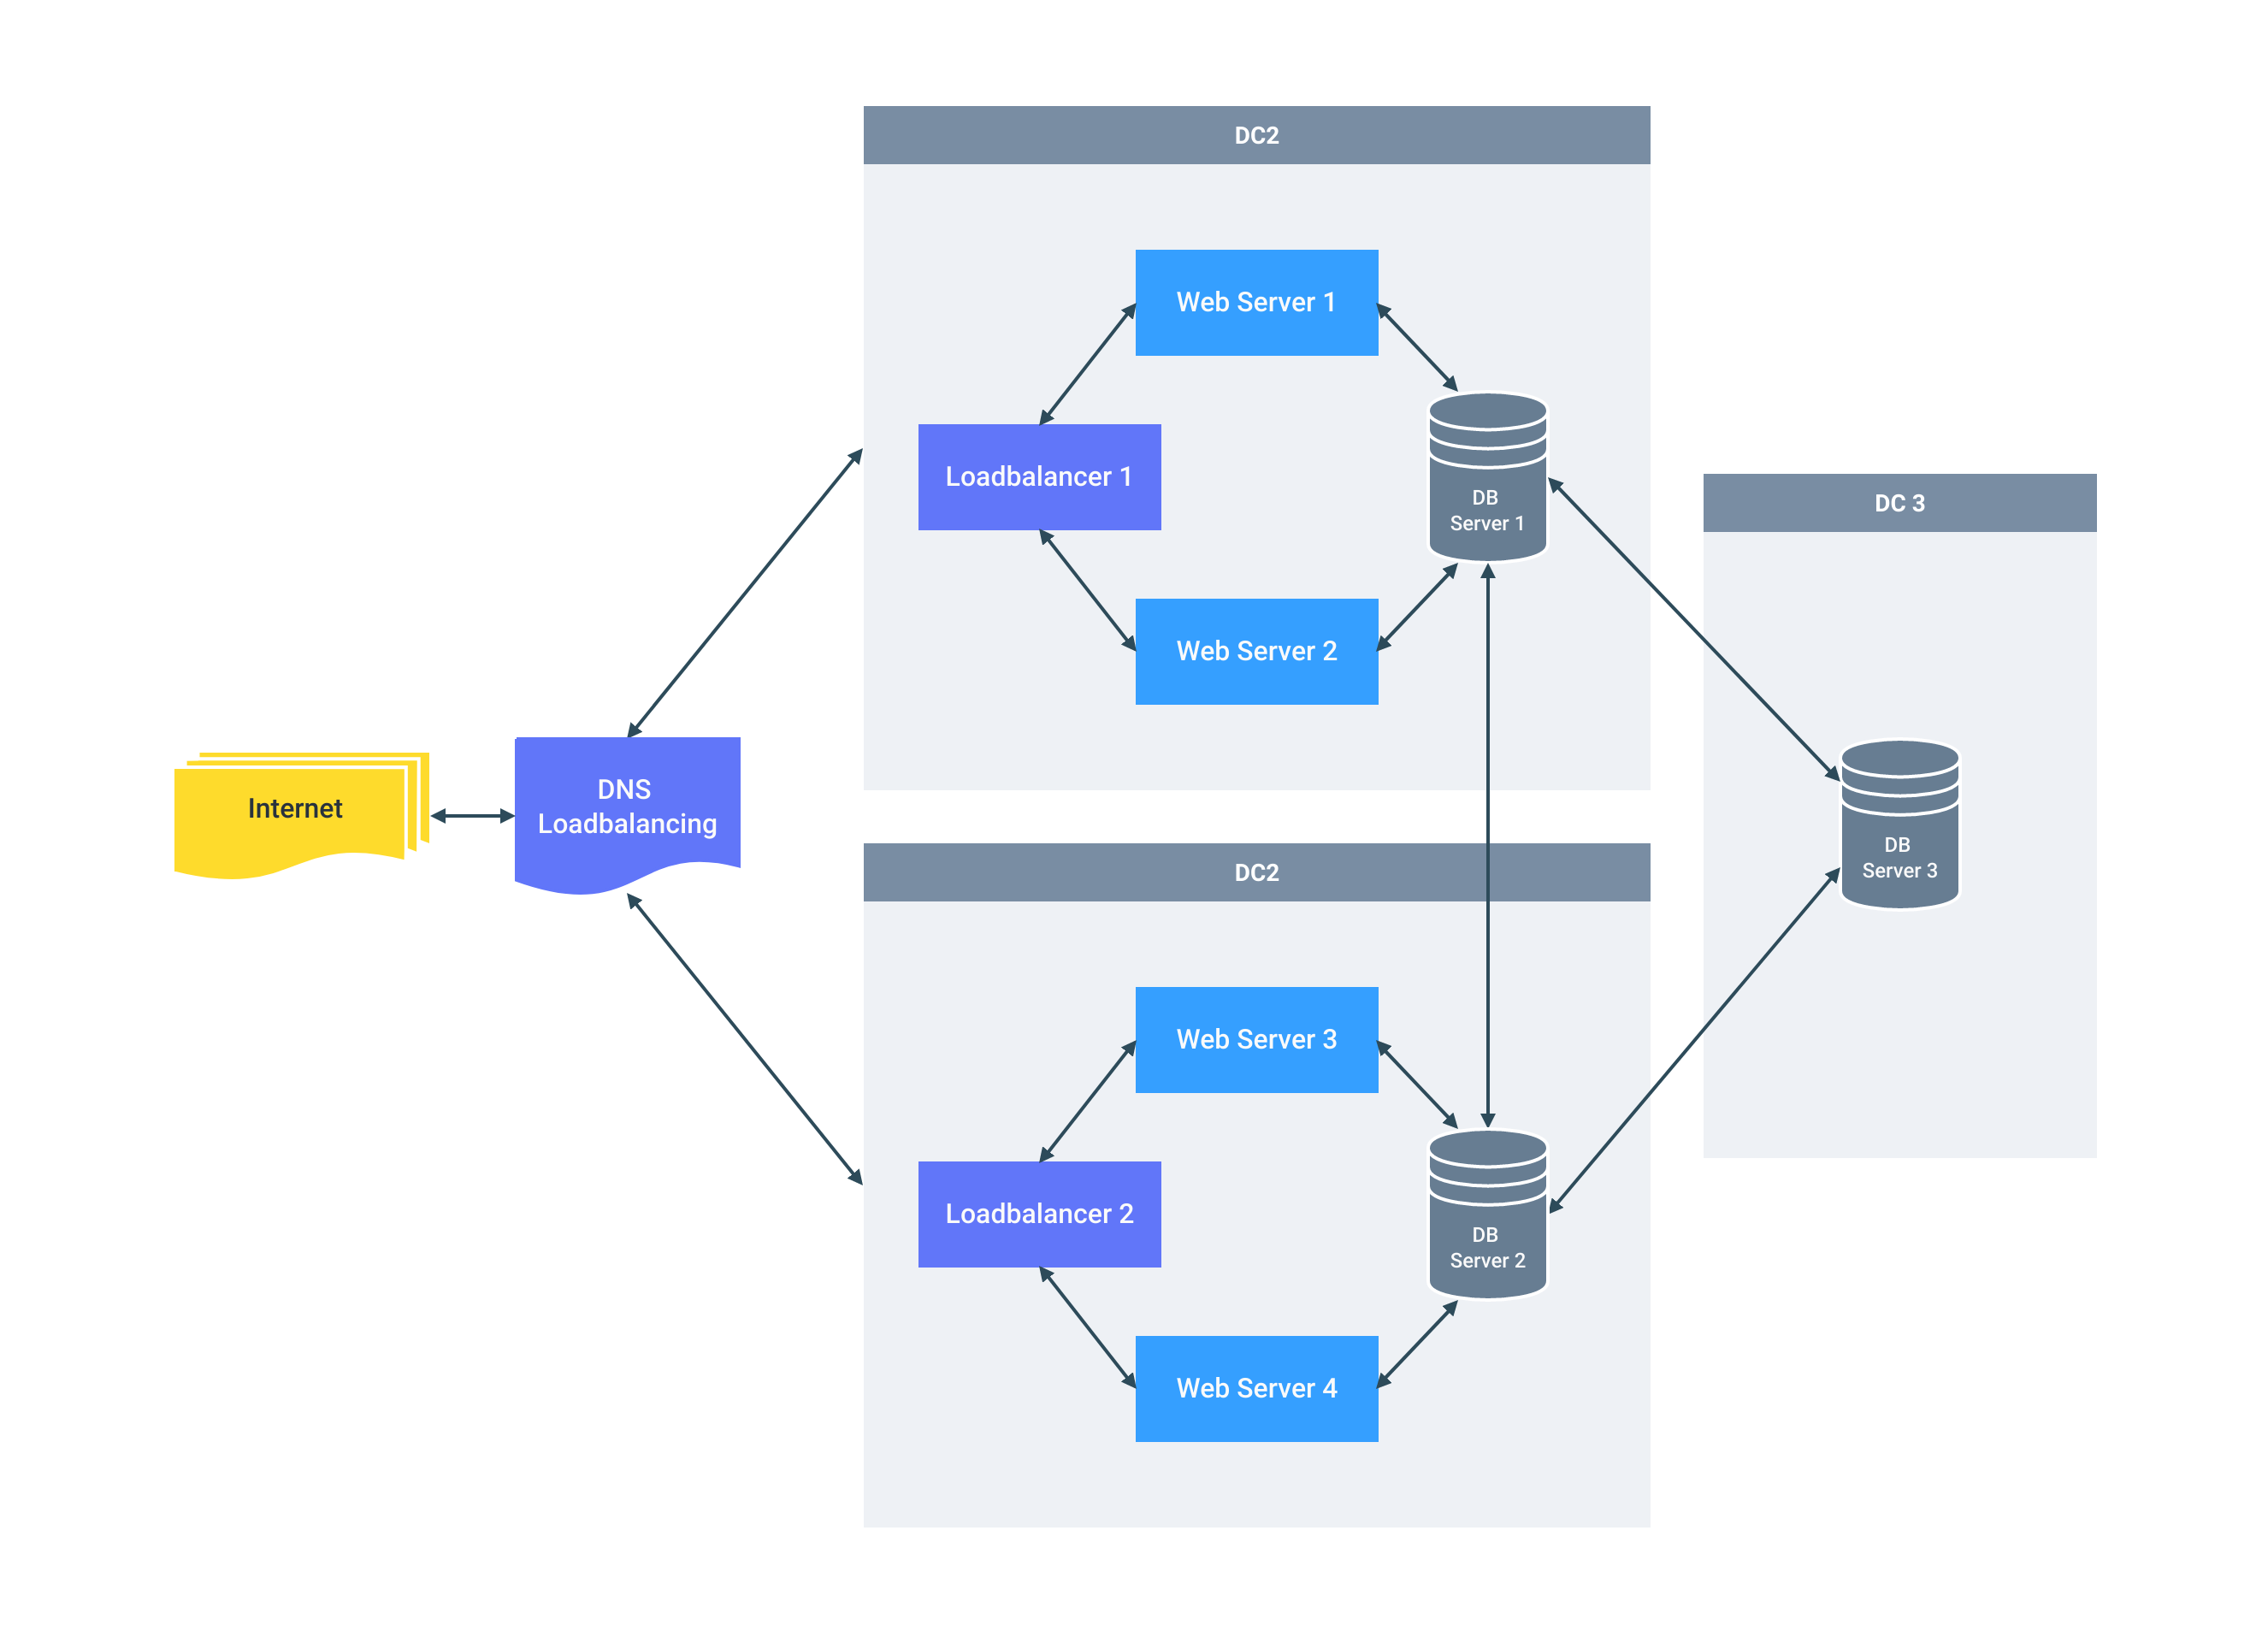
Network Diagrams
Containers allow your team to identify, group and label related components as you map out any kind of complex network.
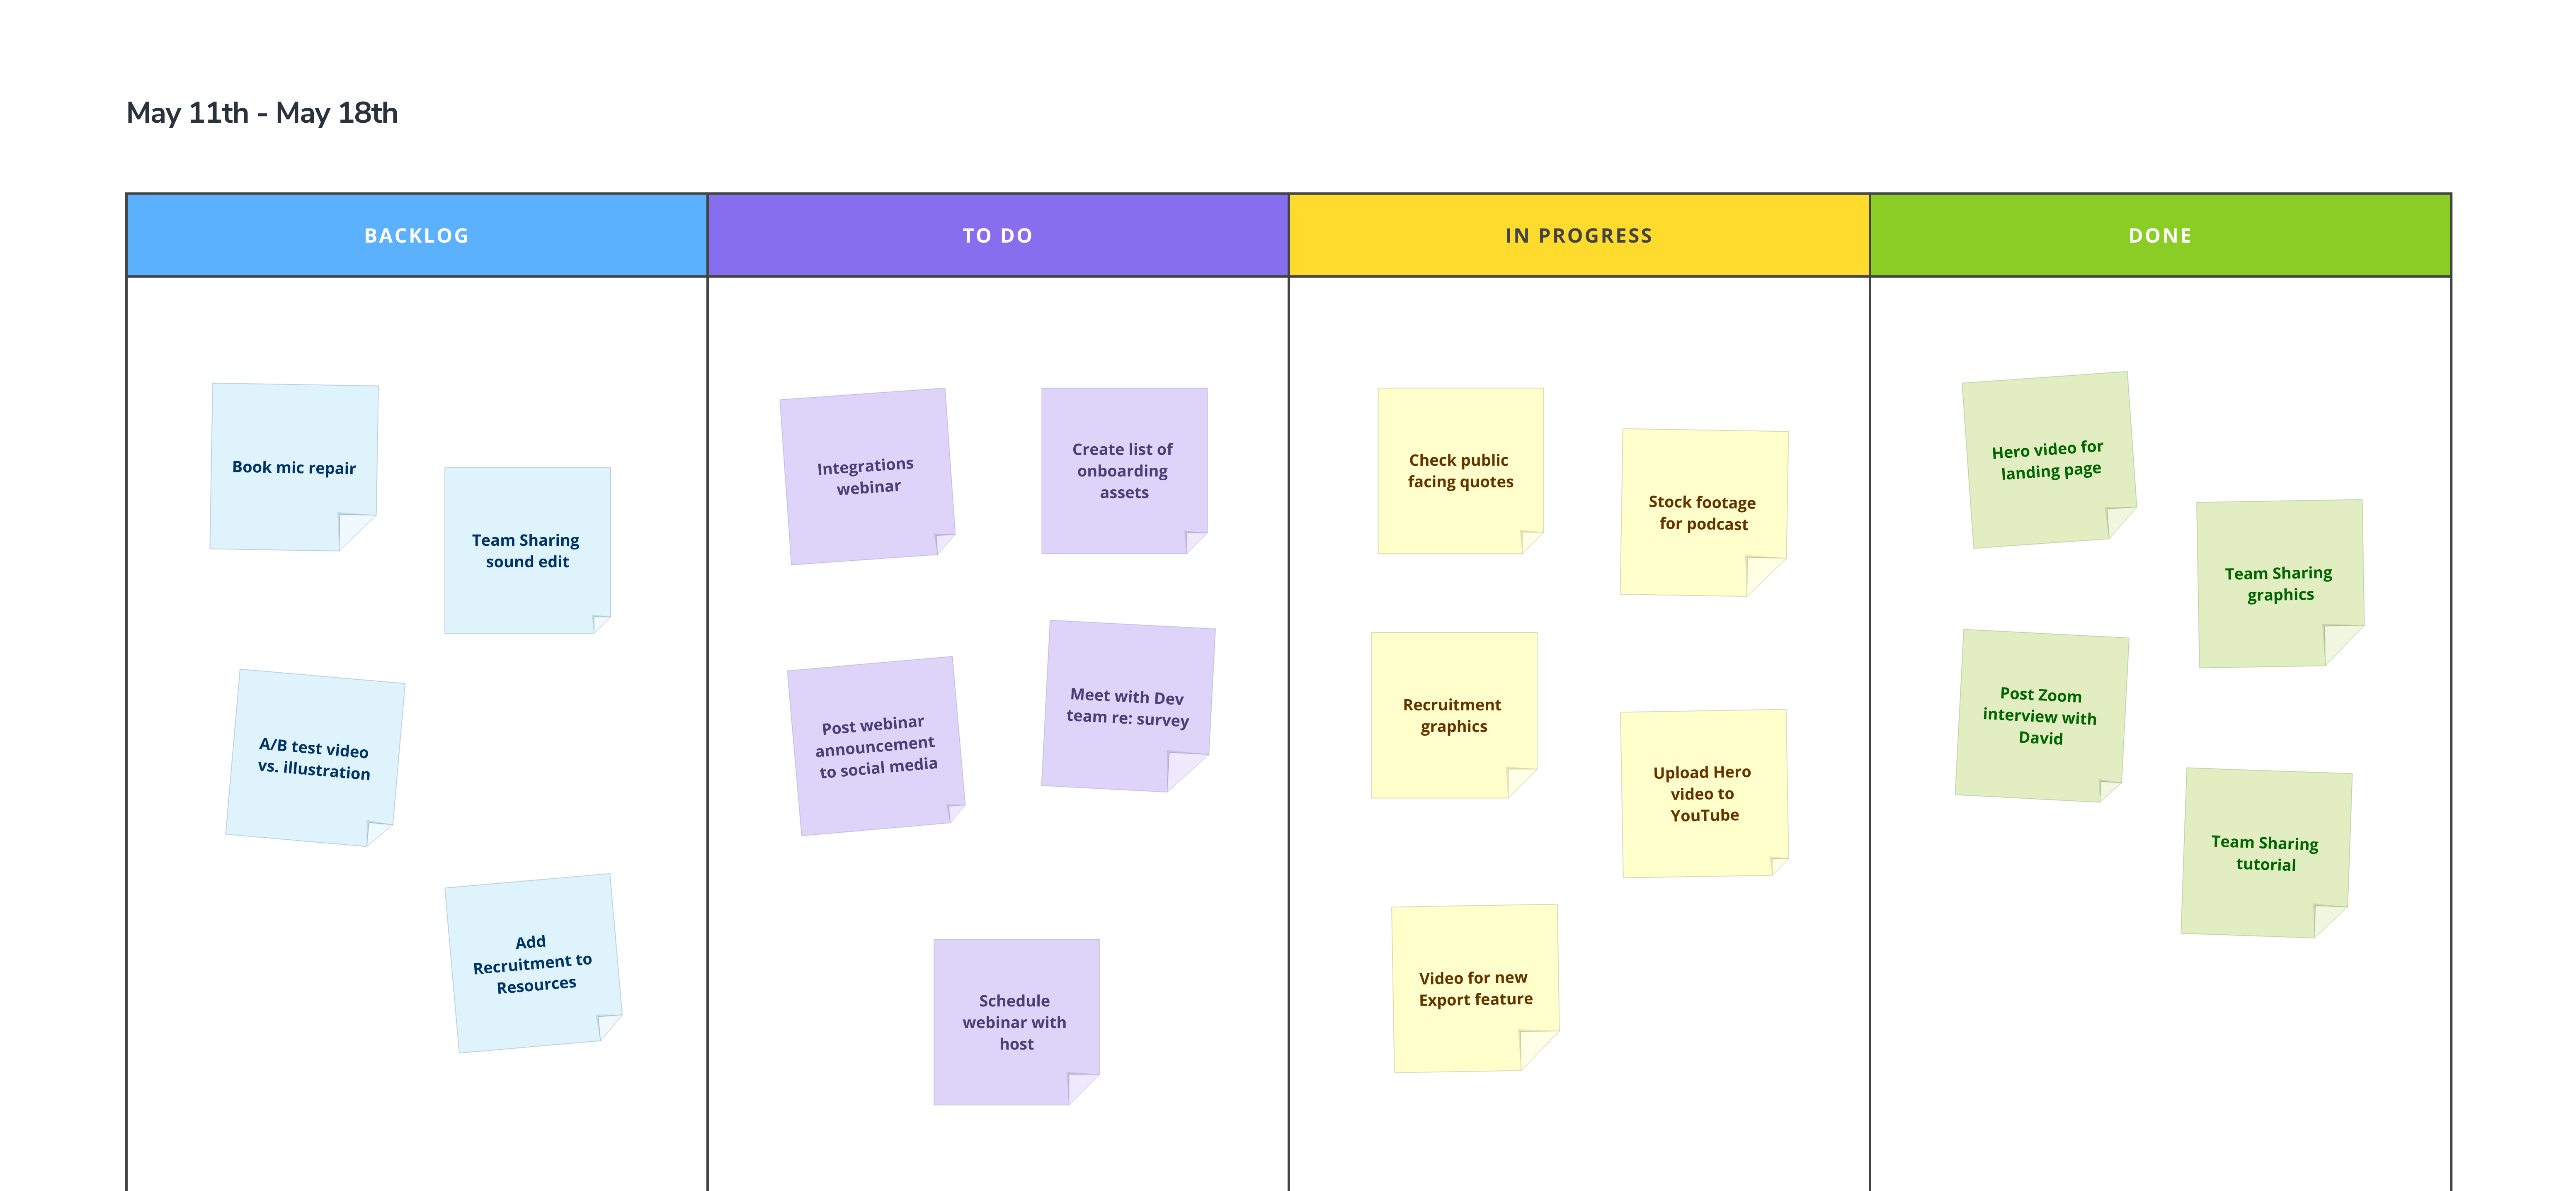
Kanban Boards
Containers are great for building Kanban boards that help agile teams visualize, manage, analyze, and optimize their workflow.
Deleting a container doesn't delete the elements within it.
Replace diagram stencils
You can quickly update and replace diagram stencils that are already part of a diagram on the page. To swap out a stencil, just drag the new stencil over an existing one, and drop when the ‘replace’ symbol appears.
Replace works on all Flowchart Diagram stencils, and select Use Case stencils where appropriate.
Images and Icons also have replace capability.
Like any other Object on the page, a Diagram can be made interactive too. Go here to read more about Interactions.
Paste lists and CSV data in diagram format
Our Paste in Format feature makes it easy to turn your lists and data into instantly populated flowcharts:
- Copy a list or CSV from your desktop
- Use
Ctrl/Cmd+Vto paste that data onto your Moqups page - Click the Flowchart button on the Pick a Format modal