Template Name
Description
Excerpt
- No results found.
Venn Diagram Templates
Highlight the similarities and differences between data sets with our Venn diagram templates. Quickly customize to illustrate the relationships between your products, services, or processes.
What are Venn diagrams used for?
Venn diagrams visualize the logical relationships between different data sets or concepts. This type of comparative analysis chart maps similarities, differences and overlaps, making complex information easy to understand and analyze.
Choose from our free Venn diagram templates to create compelling visuals for dashboards, reports and presentations. The following Venn diagram examples include options for 2, 3, and 4 data sets.
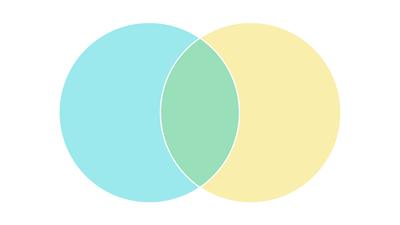
2-Set Venn Diagram
This classic Venn diagram template maps the intersection between two data sets by highlighting both shared and unique elements. It's perfect for simple comparisons and for illustrating basic relationships.
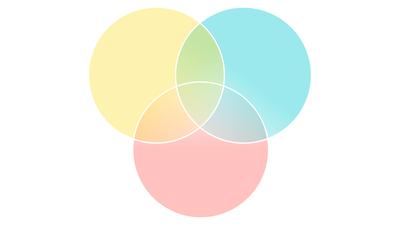
3-Set Venn Diagram
Expand your comparative analysis with this editable Venn diagram. Our three-circle template allows for more complex relationships to be explored by showing all possible intersections and unique elements amongst three data sets or entities.
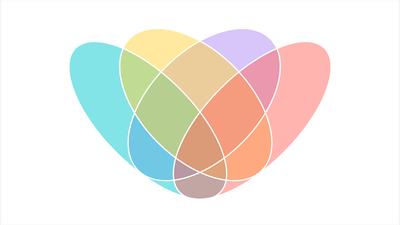
4-Set Venn Diagram (Flower)
Resembling a flower, this visually appealing Venn diagram template allows for the comparison of four data sets. It highlights multiple intersections and unique elements, making complex data analysis easy to understand.
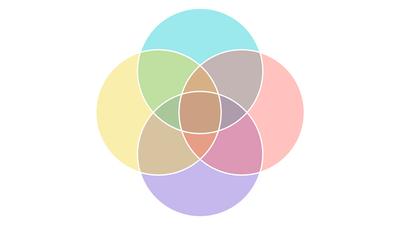
4-Set Venn Diagram
This advanced template enables the comparison of four distinct sets or categories. It's perfect for complex analyses, helping to identify shared attributes and unique characteristics across multiple groups in a structured, easy-to-understand layout.
Choose from 100+ pre-designed templates
Match your use case and get your team going!
Sign up for free