Template Name
Description
Excerpt
- No results found.
- No results found.
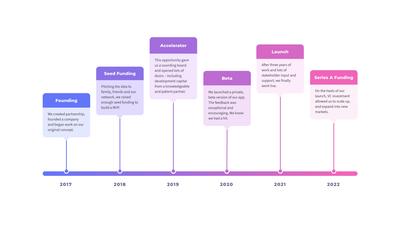
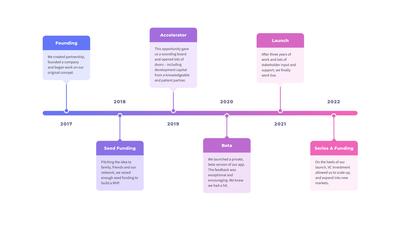
Timeline Diagram Template
Create a professional and colorful timeline infographic online in minutes. Visualize key events, milestones, goals, and deadlines with our free timeline template.
A timeline chart is a great way to represent any series of events in chronological order.
Visualizations of key milestones along an event timeline – whether in the past, present, or future – can help tell the full story of any process. Timelines can be applied to historical events, personal goals or, most commonly, sequential phases of a project.
If you and your team need to create a timeline for a company, school, or organization, you can save a lot of time, and kick-start the process with our easy-to-customize timeline template.
What is a timeline diagram?
By providing a high-level overview of a step-by-step sequence, timeline charts can be used to illustrate, explain, analyze, track, or evaluate a chain of events.
Most people are familiar with history timelines that chronicle the development of nature and civilization over eons, millennia, centuries, or decades.
In business, corporate roadmaps more commonly focus on a shorter 12 month timeline. And in science and journalism, especially for climactic events, intervals may be measured in days, minutes, or even seconds.
The timeline template below is a sample version that’s easy to adapt to your own needs, timeframe, and content.
What are the use cases for timeline diagrams?
Timelines are used in all kinds of circumstances because they provide such a wide range of benefits.
By visually mapping out key deadlines, timeline diagrams help teams assess the scope of any project – and the resources needed to wrap it up successfully! By tracking key milestones from conception to completion, they allow your team to measure progress against initial estimates. This can help them evaluate their own performance, identify blockers, adjust both pacing and priorities, and manage expectations.
For start-ups, business timelines form an essential part of their business plan, identifying what’s already been accomplished, and scheduling important and upcoming goals for the next couple of years.
Once they’re up and running, companies can use planning timelines to make their organizational strategy more transparent, keep stakeholders aligned and up to date, and improve overall morale by helping employees anticipate what will be required of them.
For individual initiatives, project timelines allow teams to visualize the arc of an entire project and anticipate the resources they’ll need – making scheduling more reliable and increasing efficiency. This also helps them identify dependencies, assign key tasks, and make sure nothing falls between the cracks.
Marketing teams often need to juggle dozens of interrelated tasks, and track projects along multiple communication channels. That’s why they often use a multi-layered marketing timeline, in the form of a Gantt chart, for project management. Check out our Gantt Chart Template if that’s what you’re looking for!
How can I customize my free timeline template
To leverage the power of a timeline chart, you don’t need to start from scratch. Instead, use our free timeline template to help get you going, and then quickly customize it to fit your needs.
With just a few clicks, you can create a colorful infographic by adding your own milestones, goals, deadlines or historical details. Then, change the color scheme, size, and spacing of the timeline elements to suit your brand and style.
Color-coding data, applying gradients, and adding pictures, icons, emojis, and sticky notes can all increase the effectiveness and readability of your timeline design.
If you want to further customize your chart, you can replace any element just by dragging and dropping a new shape from our extensive library of stencils. And, you can provide space for additional details by adding text boxes or sidebars.
The benefits of Moqups over Powerpoint and Excel
With Moqups, your team can work together online and in real time – from anywhere – to build a timeline. Team members can chat, annotate, follow each other’s cursor, and leave comments right on the page as they design, structure and style.
And don’t worry about making changes. Our smart connectors help everything stay attached, so elements won’t get tangled – even as you move things around. You can easily add, delete, or modify elements to adapt to an evolving plan. Most importantly, all your changes will be reflected, and communicated, in real time.
Best of all, your timeline chart doesn’t have to stand alone. You can expand its utility, and help it tell a bigger story, by applying interactivity to any element within your chart. That way, you can quickly link to biographies, calendars, additional charts, or external documents.
Because our timeline maker lives in the Cloud, your team can collaborate without having to deal with multiple-files for every new iteration – like with Microsoft Powerpoint or Microsoft Excel. You can keep work private while it's still in progress, and then distribute your timeline presentation company-wide via shared URL when you’re ready for primetime. And, you can export your timeline to PNG or PDF for use on social media or offline.
To get started, just click on our timeline sample above or the button below!