To get the most out of Moqups, take a look at each of the following categories or, if you already know what you want, click on a link to jump to your use case:
- Begin with a Wireframe
- Diagram Anything
- Whiteboard Live With Your Team
- Visualize Data for Dashboards
- Get instant answers
Begin with a Wireframe
New to wireframing or just new to Moqups? Either way, here are some key tips and tools to help get you going – and save you time!
1. Jump-start your wireframe project with a template
Don't want to start from scratch? Our multi-page template bundles have all the elements you need to create landing pages, admin dashboards, mobile apps, or e-commerce sites.
2. Sketch out ideas
Use our Quick Draw toolkit to get ideas out of your head and onto the page – fast! Add shapes, text, connectors and interactive hotspots, or just draw freeform.
3. Build up your wireframe
Find everything you need – stencils, icons, and UI elements – to create rough-draft mockups or detailed wireframes.
4. Refine your design
Add brand logos and customize colors, fonts, and style to polish your wireframe and make it presentation-ready.
Diagram Anything
As you map out your first diagram in Moqups, here's a super-quick orientation to help you find everything you'll need.
1. Save time with a diagram template
We have all kinds of ready-to-go templates that can help you kickstart your diagram. Find one that fits your needs – then customize it and make it your own!
2. Find all the shapes you need
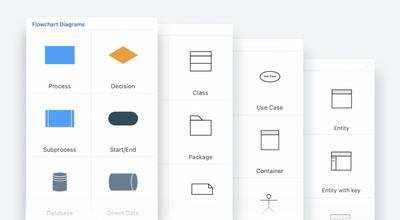
Choose from our comprehensive library of industry recognized flowchart symbols for UML, Use Case, ERD Model, and Process Flow diagrams.

3. Drag, drop and connect
Our smart connectors will stay untangled as you build out your flow and move things around. Pick the right start-and-end markers and add some quick labels for extra clarity.
4. Extend, replace and style
You can expand your flows automatically, with one fast click, and drop-to-swap shapes as your diagram evolves. Then, just color and style your diagram and you're ready for prime time!
Whiteboard Live With Your Team
Moqups has all the tools you need to strategize, share ideas, and collaborate in real time, and here's how they work!
1. Strategize with a framework
Learn from best-practices by starting with our prebuilt frameworks, boards, maps, and agendas. Organize brainstorming sessions, run virtual workshops, or manage agile workflows.
2. Notes, annotations and emojis
Your team can capture ideas, feedback and reactions – in real time – by adding sticky notes, images, annotations, icons and emojis.
3. Smart-add arrows
Maintain momentum and expand on ideas at the speed of thought. Smart-add arrows help your team keep up with the flow of ideas, no matter how fast.
4. Live presence and cursor
When you're collaborating, just click on a teammate's avatar to jump to where they're working. Or use Live Chat to pull everyone together for quick consensus.
Visualize Data for Dashboards
Our chart and graph-maker lets you put the 'art' in your chart, make numbers beautiful, and turn raw data into compelling stories and dashboards.
1. Begin with a chart or graph template
Pick from more than 100 professionally designed templates and chart types for all kinds of use cases. No need to start from scratch – although you can drag and drop to do that too!
2. Add your data set in seconds
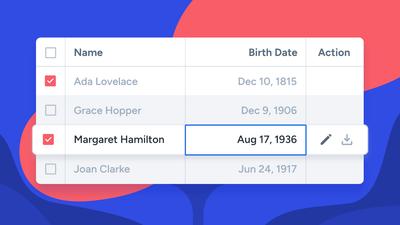
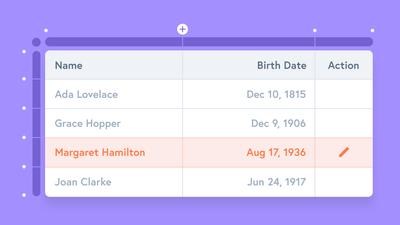
Need a quick visualization for your latest stats? Enter data into our fully editable table, or paste directly from a CSV and you're good to go!
3. Experiment to find the right chart
Find the visualization that works best for your data and audience with our new quick-switch buttons. It only takes a single click to find the chart that clicks!
4. Customize and share your graphs
Customize to fit the context of your dashboard or report with lightning-fast controls. Present to your team, share links online, post to social media, or export to PNG and PDF.
Get instant answers
If you want to dig deeper into these, or any other Moqups features, search our Help Center for step-by-step guides to get you going. And don’t forget, our support team is just a click away at support@moqups.com.


