Template Name
Description
Excerpt
- No results found.
- No results found.
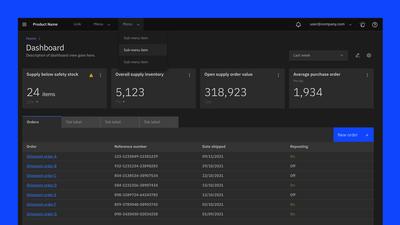
Admin Dashboard Wireframe Template
A sophisticated admin dashboard wireframe template. Monitor sales, visitors and new users for your website. Discover a template for every case.
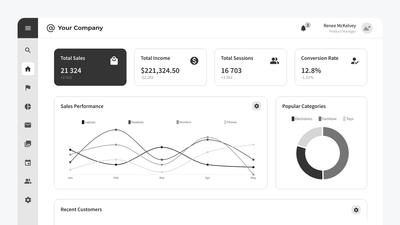
Customize our admin dashboard wireframe template to track business intelligence data – and effectively monitor your sales and website traffic.
More about Moqups’ admin dashboard wireframe
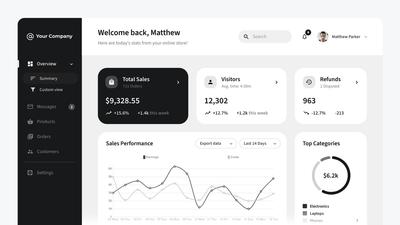
Business Intelligence dashboards provide real-time visibility for your team by displaying key performance metrics.
By tracking trends and visualizing analytics, departments can answer pertinent questions, make informed decisions, and take meaningful action.
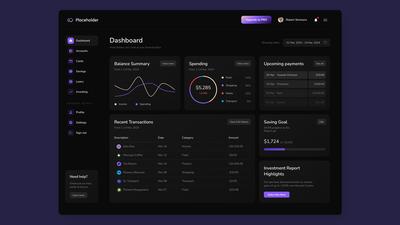
Start building your admin dashboard with Moqups' wireframe bundle. This full selection of templates includes Sales, Sales with Sidebar, Visitors, Visitors with Sidebar, and New User templates.
Click on any template to open the Moqups app – and start adapting our wireframe templates to match your requirements!