Template Name
Description
Excerpt
- No results found.
- No results found.
Concept Map Template
Build a comprehensive concept map online in minutes. Capture related ideas and visualize the relationship between them with our free concept map template.
Why use a concept map?
Concept maps can be used to explore the various facets within a single concept, or to visualize the complex relationship between multiple but related ideas.
Concept maps show the relationship between ideas in the same way that road maps show the relationship between places – by visualizing how things connect, and how to get from one point to another.
Whether you’re looking to draw connections between existing concepts, or understand an entirely new idea, our online concept map template is easy to customize and ready to go!
What is a concept map?
Concept maps are a great way to visualize nascent, abstract, or evolving ideas. They are especially useful during brainstorming and planning because they help teams collect and connect all the related aspects and implications of a central idea.
There is no set structure to a concept map. Depending on the idea you’re exploring, the shape of your visualization might be radial, hierarchical, or multi-nodal.
Because the subtopics of any idea can be so varied – and the relationships between them so diverse – concept maps often use flowchart arrows to indicate how different elements of the concept impact one another.
These connector arrows are typically labelled with linking phrases (includes, causes, results from, requires, constrains, contributes to, is determined by) that further define the relationships between elements. Linking phrases are particularly important if your map examines multiple aspects of a single concept: what it is, what it does, how it came to be, how it can be applied, etc.
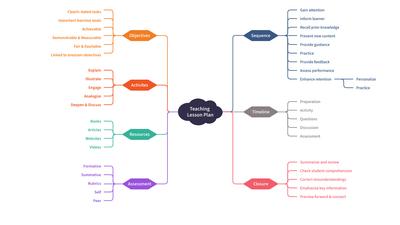
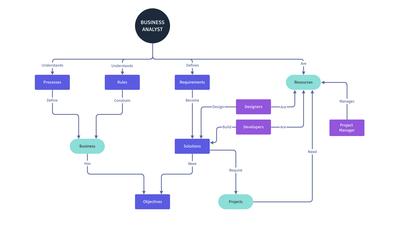
The concept template below is a great example and starting point. It uses both flowchart arrows and labels, and can be easily adapted and expanded to fit the needs of your team:
Who invented concept maps?
Joseph D. Novak, an American professor and educational theorist, first developed concept mapping in the 1970s.
He and his research team at Cornell University were looking for a way to represent developing knowledge – in other words, how people assimilated new ideas within their existing cognitive structures. That meant mapping both their initial conception of an idea and how they extended that concept as they learned.
Concept maps quickly caught on in fields of business, government, and education as a way to visualize the synapses within a complex idea, initiative, or organization.
What is the difference between concept mapping and mind mapping?
Mind maps and concepts maps are similar in that they’re both visualizations used to capture ideas. However, they do have some distinct differences.
Mind maps are generally used to brainstorm a single concept – often including unfiltered, blue sky thinking. This allows individuals and teams to look at an idea from all possible angles, while capturing and organizing all its possibilities. As a result, mind mapping generally follows radial hierarchies and branching tree structures that terminate in dead ends.
Concept maps, on the other hand, examine the complex relationships between or within concepts. As a result, they can take almost any form, but often have a multi-nodal shape that shows the flow from one point to another.
Whereas mind maps tend to focus on one word or idea, concept maps normally connect multiple words or ideas, often incorporating connector labels to help clarify the exact nature of each connection. In this sense, a concept map is a kind of hybridization of a mind map and a flowchart.
To get a sense of the difference, check out our collection of Mind Map Templates.
What are the main use cases of concept maps?
Concept maps can be applied to abstract ideas or highly practical concepts. They are used in the fields of business, governance, education, research, and management as a way to...
Think
Because our brains are highly effective at processing and retaining visual information, both individuals and teams can benefit from mapping out their thoughts during note-taking and brainstorming sessions.
Plan
Because they can visualize and simplify highly complex systems, concept maps are used to analyze and plan across a wide variety of domains including Sales, Medical, HR, Operations, and Knowledge Management.
Learn
If you or your team are learning a new concept, mapping out the direction and scope of your ideas can help deepen your overall understanding, increase your retention, and identify gaps where further learning and research might be required.
Teach
It can be hard to fully convey the intricacies, nuances and linked relationships within a complex system. That’s why concept maps are terrific for presenting a new idea to a diverse audience – especially during onboarding or pitch sessions. Connector arrows and labels let each member take their time – and pick their own path through new material.
How do I create a concept map?
It’s easy to create your own concept map. You can start with the template above – and quickly customize it to fit your needs. Or, you can use our concept map creator to start from scratch.
Either way, Moqups allows you and your team members to collaborate in real time and work together as you sketch out your ideas.
Here’s a quick guide to help you create concept maps in 5 easy steps:
1. Identify your topic
Start by picking the main idea, thing, or theme you’d like to explore. Consider asking a guiding question about that topic in order to help establish both the scope and focus of your concept map.
2. Brainstorm ideas
Create individual shapes on your map to represent each of your related ideas, concepts, subtopics, stakeholders, components, questions, etc. Use your notes, research, intuition and collective experience to capture as much relevant information as you can. Keep your naming clean and concise, and identify any obvious gaps in your understanding.
3. Organize elements
Create logical groupings by organizing your most closely related concepts into close proximity with one another. Create categories and subcategories by formatting the shape, size and color of your elements. Make sure your main topic stands out, and then experiment with hierarchical, radial, or multi-nodal patterns to see which visualization best captures your concept.
4. Draw connections
Draw connector arrows between elements to show how they are linked. Add verb labels to these crosslinks to explain the exact nature of the relationships. Keep your linking words and phrases concise and specific, and make sure they create a clear proposition: Business Analyst [defines] Requirements. You can add connectors at any stage in the process, and then rearrange your map and edit labels as your understanding evolves.
5. Refine your map
Fine tune your concept map by adjusting your layout and further customizing your elements. Add more ideas as you revise your thinking, and then rearrange the hierarchies and flow to accommodate these additions. Finally tweak your colors and shapes to further categorize and clarify your elements.
What are the benefits of using the concept map creator tools in Moqups?
Moqups works on Windows, Mac and Linux browsers – so your whole team can share a workspace and collaborate in real time from anywhere! Along with concept maps, you can use our diagramming tool for mind maps, org charts, process maps, and more.
And, with our live collaboration tools and quick-click diagram extenders your team can build a seamless online workflow. Members can chat, annotate, follow each other’s cursor, and leave comments right on the page as they design, structure and style.
Don’t worry about making changes. Our smart connectors stay attached – and won’t get tangled – even as you move things around. You can easily add, delete, or modify elements as you update your map. Most importantly, all your changes will be reflected, and communicated, in real time.
Because Moqups lives in the Cloud, your team won’t have to deal with multiple-files for every new iteration – like with Powerpoint, Microsoft Word or Excel. Moqups integrations let you connect to Confluence and Jira, export files to Google Drive and Dropbox, and create a Trello card for any element on your diagram with just a single click!
You can keep work private while it's still in progress. Then, when you’re ready for primetime, export high-quality image files in PNG for social media and reports, or distribute it company-wide via shared links.
To get started, just click on our concept map example above or the button below!