Find the right chart and graph for your data







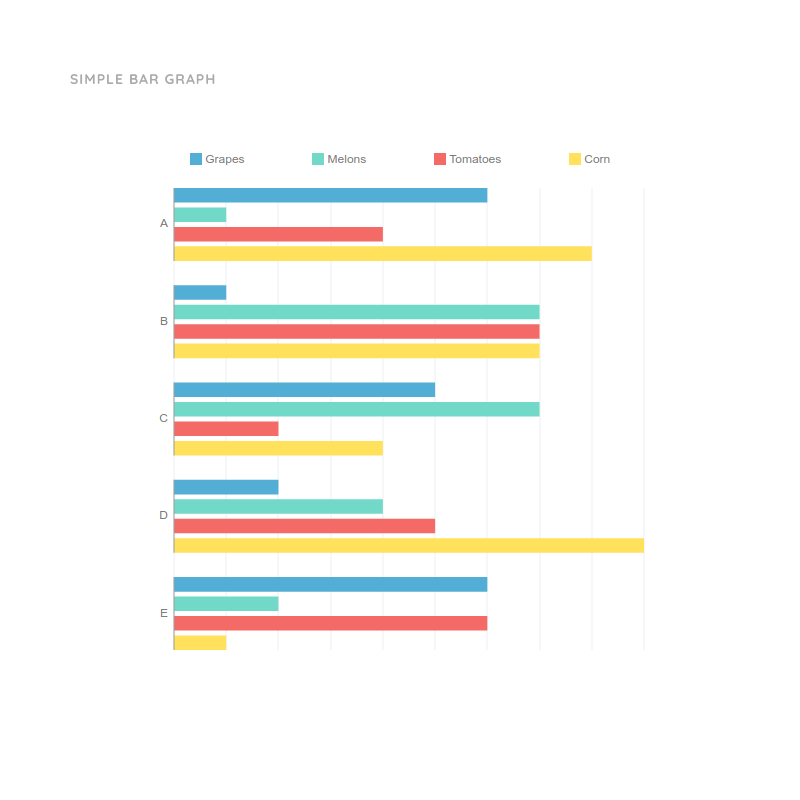 Simple Bar Graph
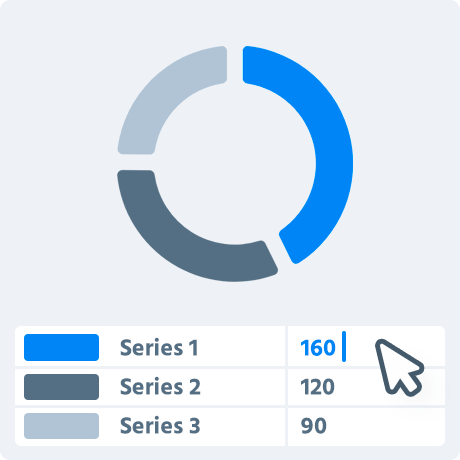
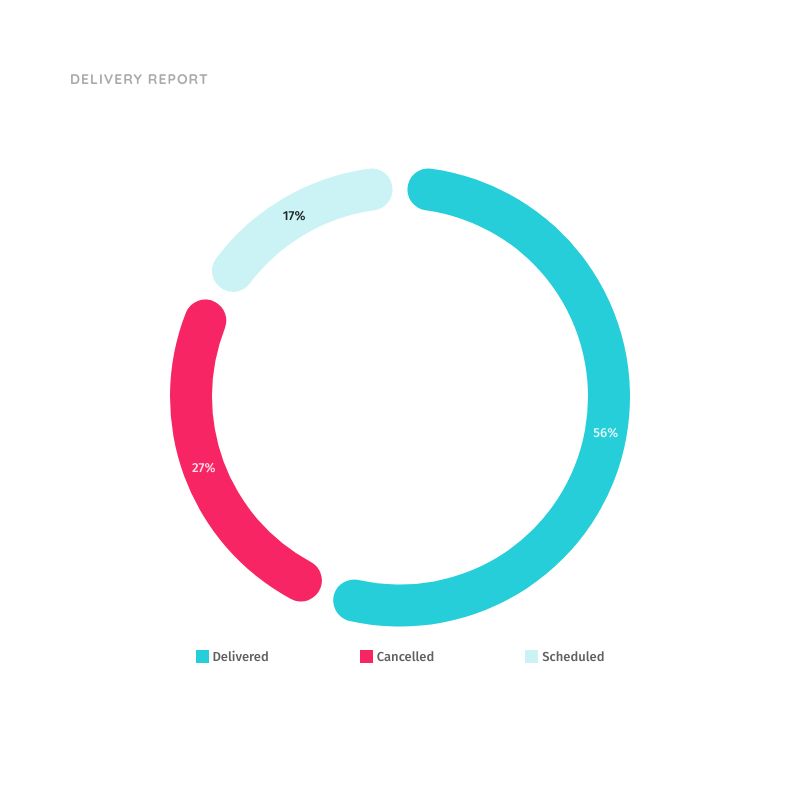 Delivery Report Donut Chart
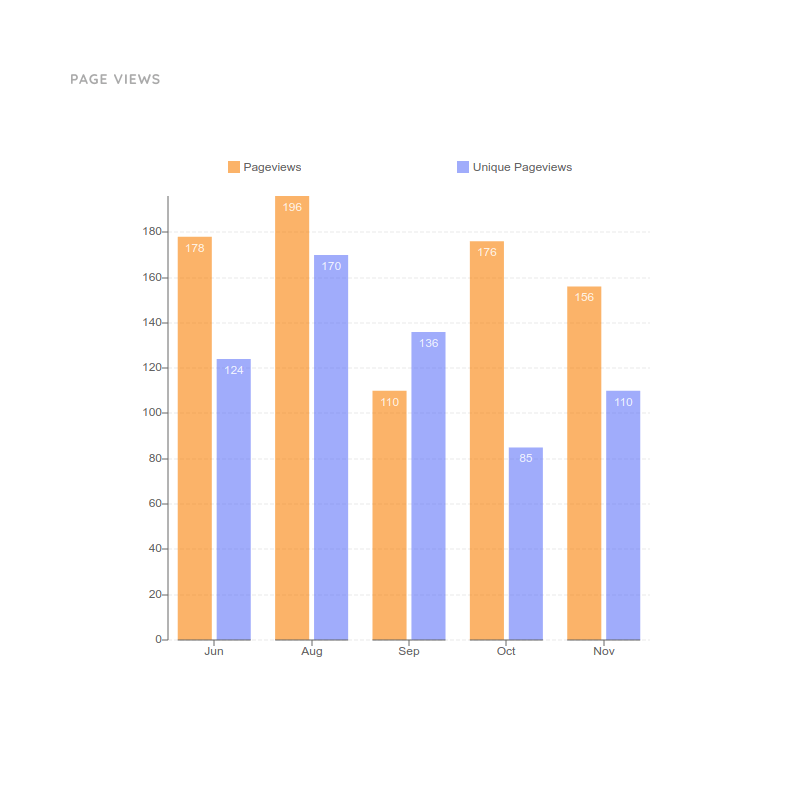 Column Chart for Page Views
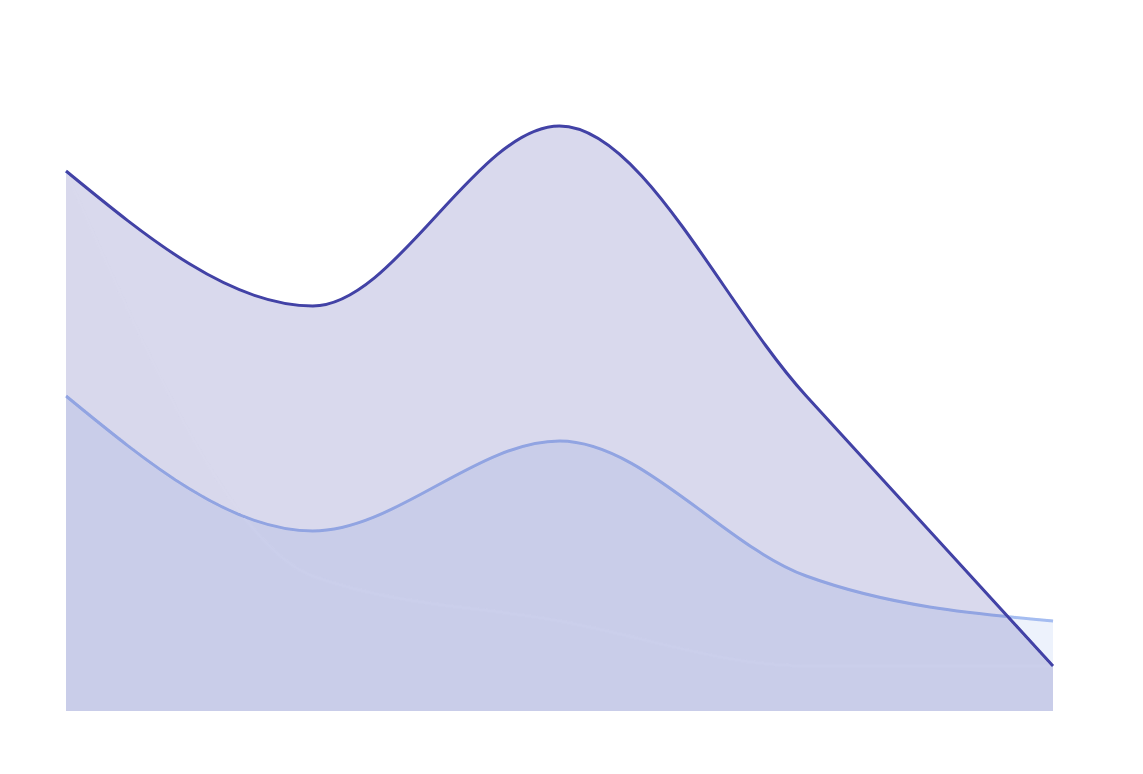
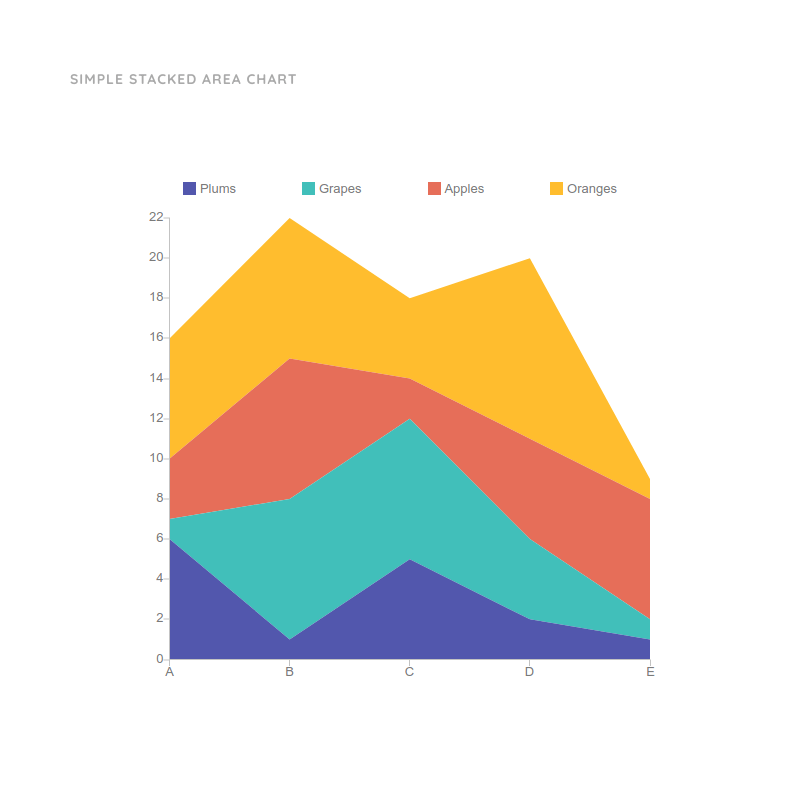 Simple Stacked Area Chart
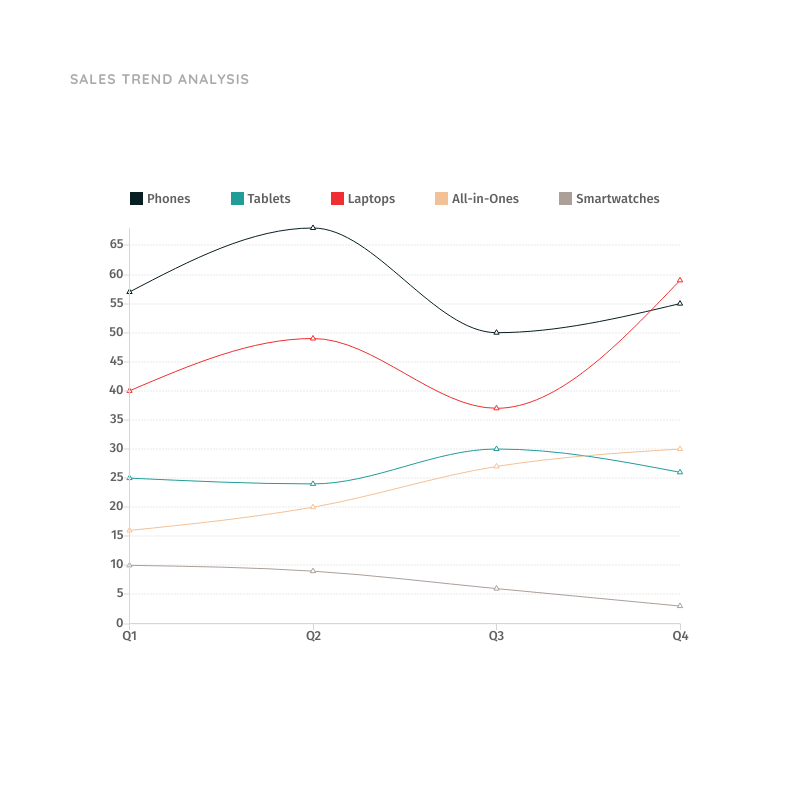 Line Chart for Sales Trend Analysis
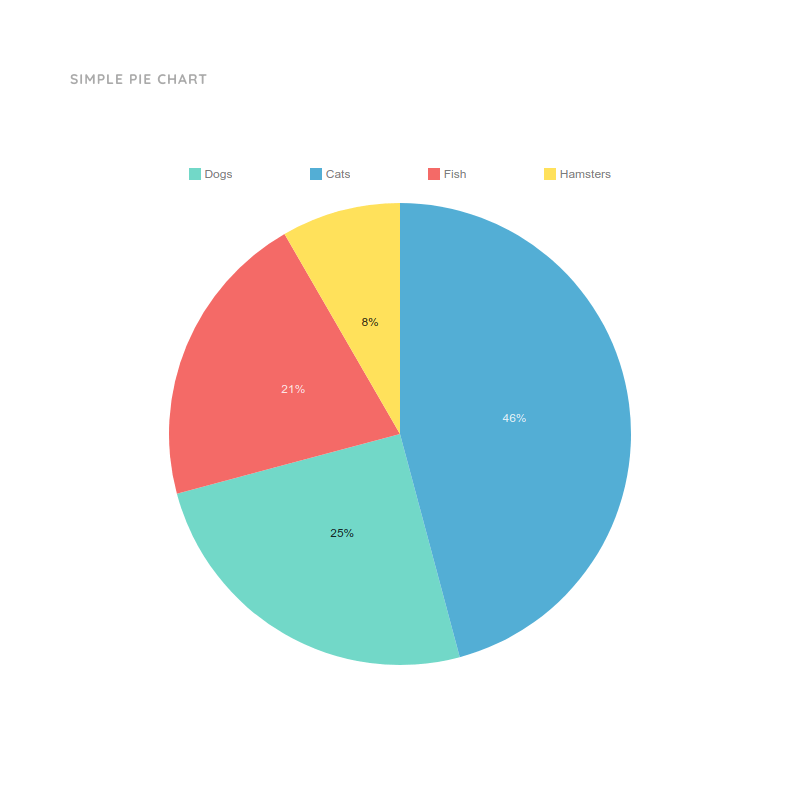 Simple Pie Chart
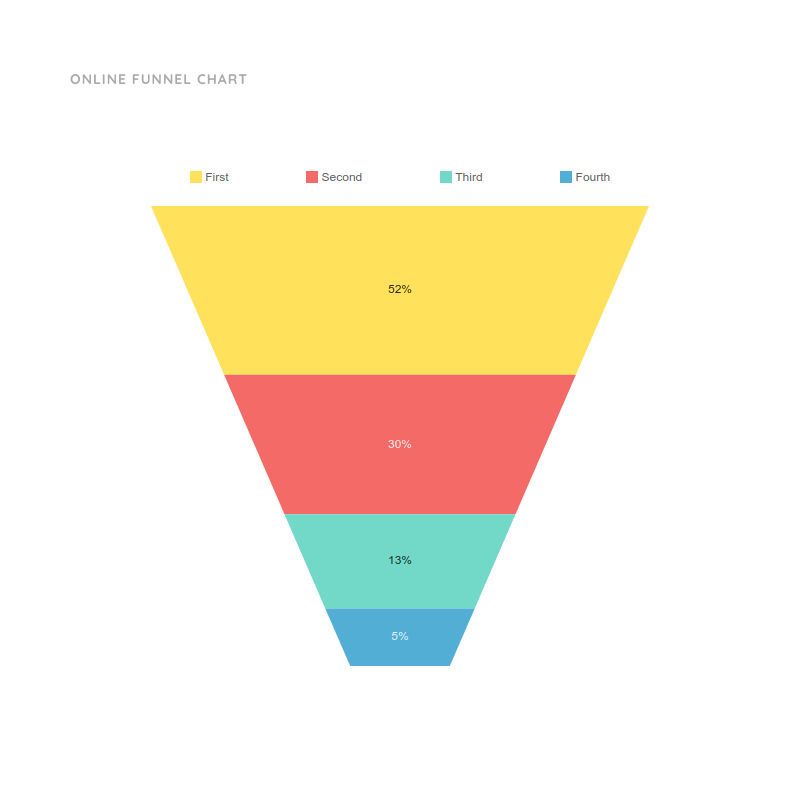 Online Funnel Chart
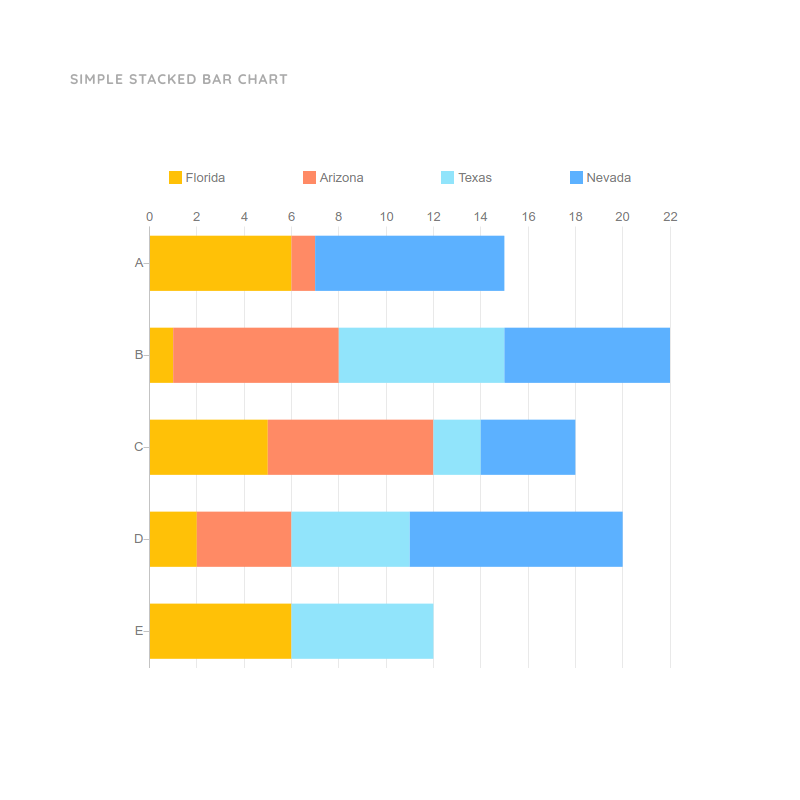 Simple Stacked Bar Chart
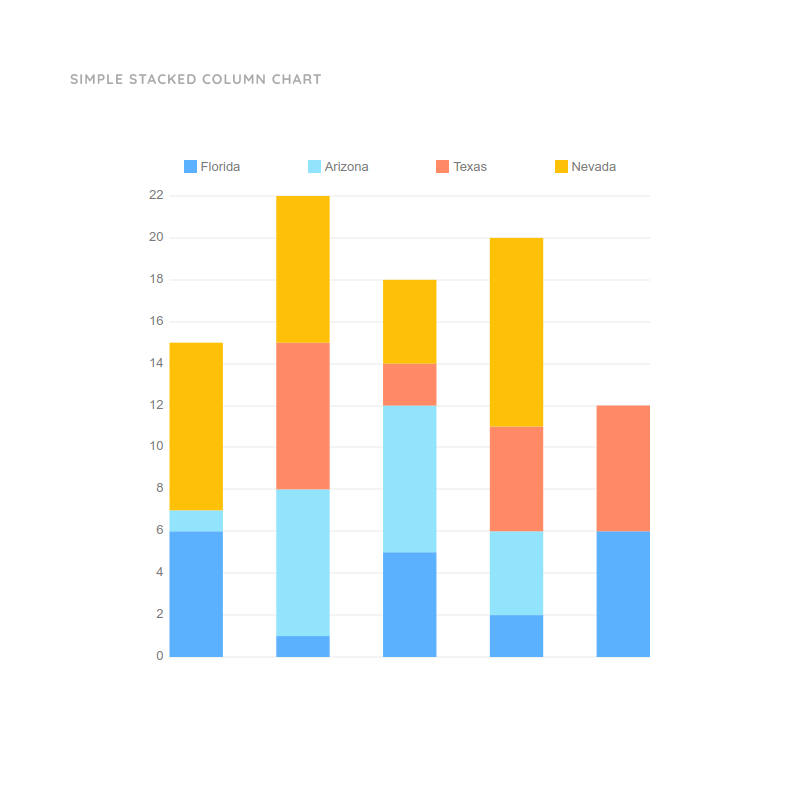 Simple Stacked Column Chart
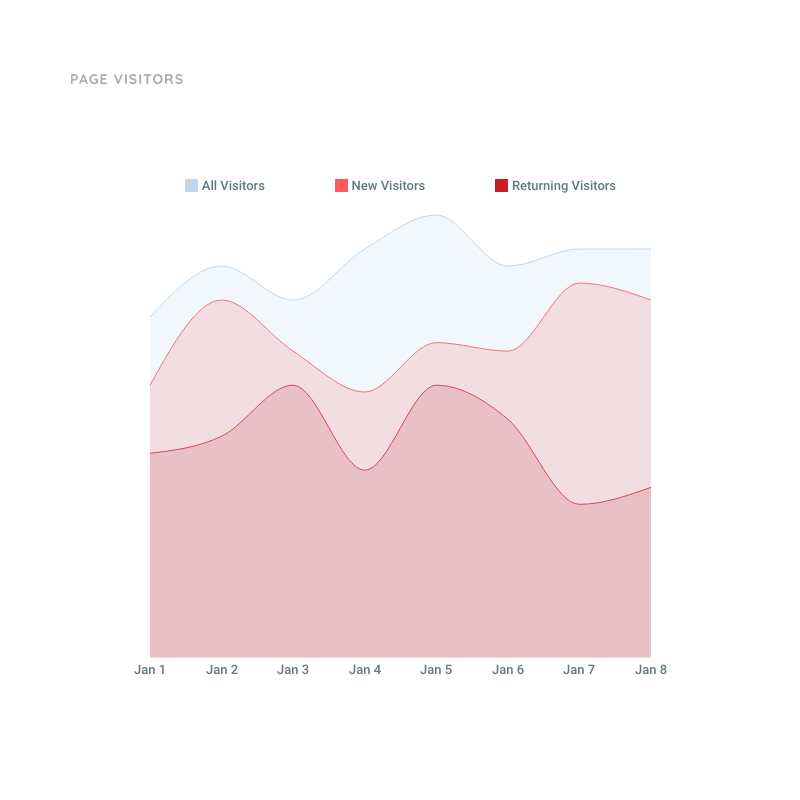 Page Visitors Area Chart
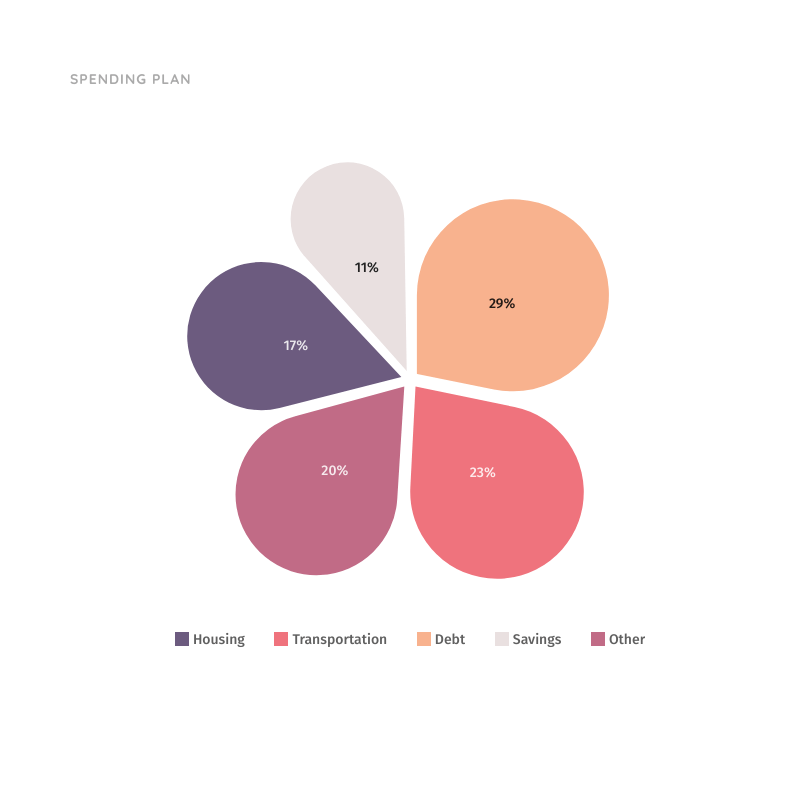 Spending Plan Pie Chart
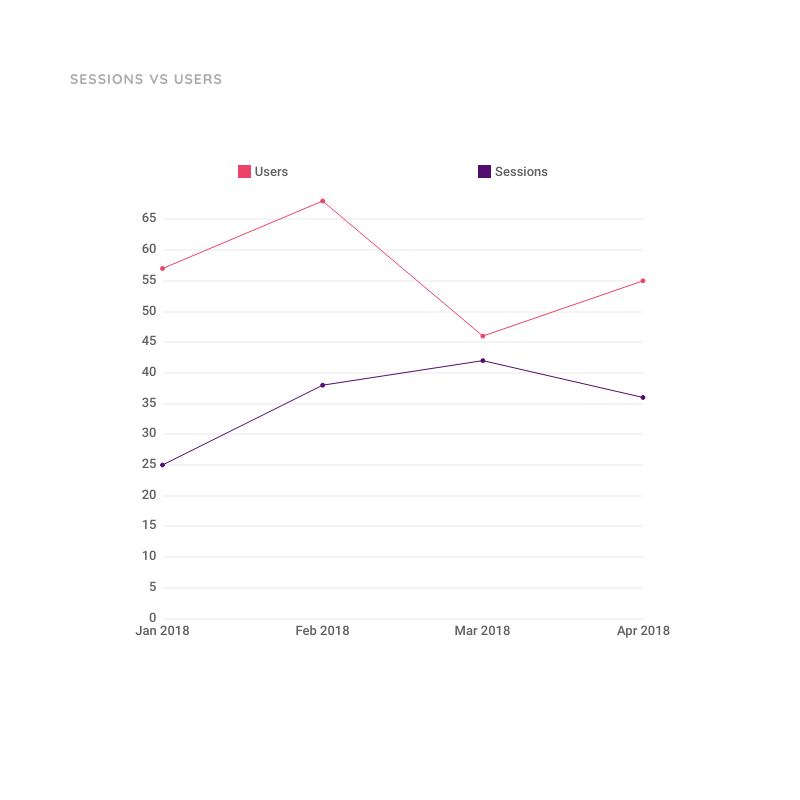 Line Chart for Sessions vs Users


Work out ideas, solve problems, and come to a quick consensus. Your team can share, communicate, and coordinate – at every level – with our visual collaboration tool.
With Moqups, I can do flowcharts and wireframes and sitemaps all in one project, which is awesome for managing.

Creating interactive wireframes for complex designs is key to our success in developing award-winning apps for our clients. Moqups' collaborative features help us communicate clearly at every stage of development – from inception to implementation.

What’s the software I spend the most time on? After communication tools, it’s definitely Moqups. It’s by far the best wireframing solution I have ever used. Such a pleasure designing our products at eFounders in a product that itself is elegant and intuitive.

Take Moqups for a test drive and discover why it's the best graph maker for your whole team.
As both a product owner and a CEO with 75 employees, I use Moqups primarily for product design. But we’ve also used it for everything from org charts to laying out our office space. It’s incredibly intuitive, fast, and accessible everywhere. It’s literally my favorite tool.